Erosion Features
Overview
The Erosion Features module in TytonIQ provides detailed mapping and measurement of erosion within rehabilitation polygons. Using high-resolution aerial imagery and elevation models, this tool identifies erosion features, calculates their dimensions, and tracks erosion volumes over time. Users can review erosion at both the polygon scale (total erosion depth and volume) and the individual feature scale (specific measurements per erosion scar).
Key Features
1. Interactive Filtering and Navigation
Users can refine displayed erosion features using filters in the bottom panel:
- Site: Project location (e.g. Fitzroy Hill).
- Polygon: Rehabilitation polygon containing the erosion features (e.g. FRH-0297).
- Survey Date: Imagery date from which erosion metrics were derived (e.g. 2 Apr 2024).
- Feature Name: Unique erosion feature identifier (e.g. SI_ER_73).
Erosion depth classes can be toggled in the Layers Panel, ranging from 0.00–0.06 m to >1.25 m.
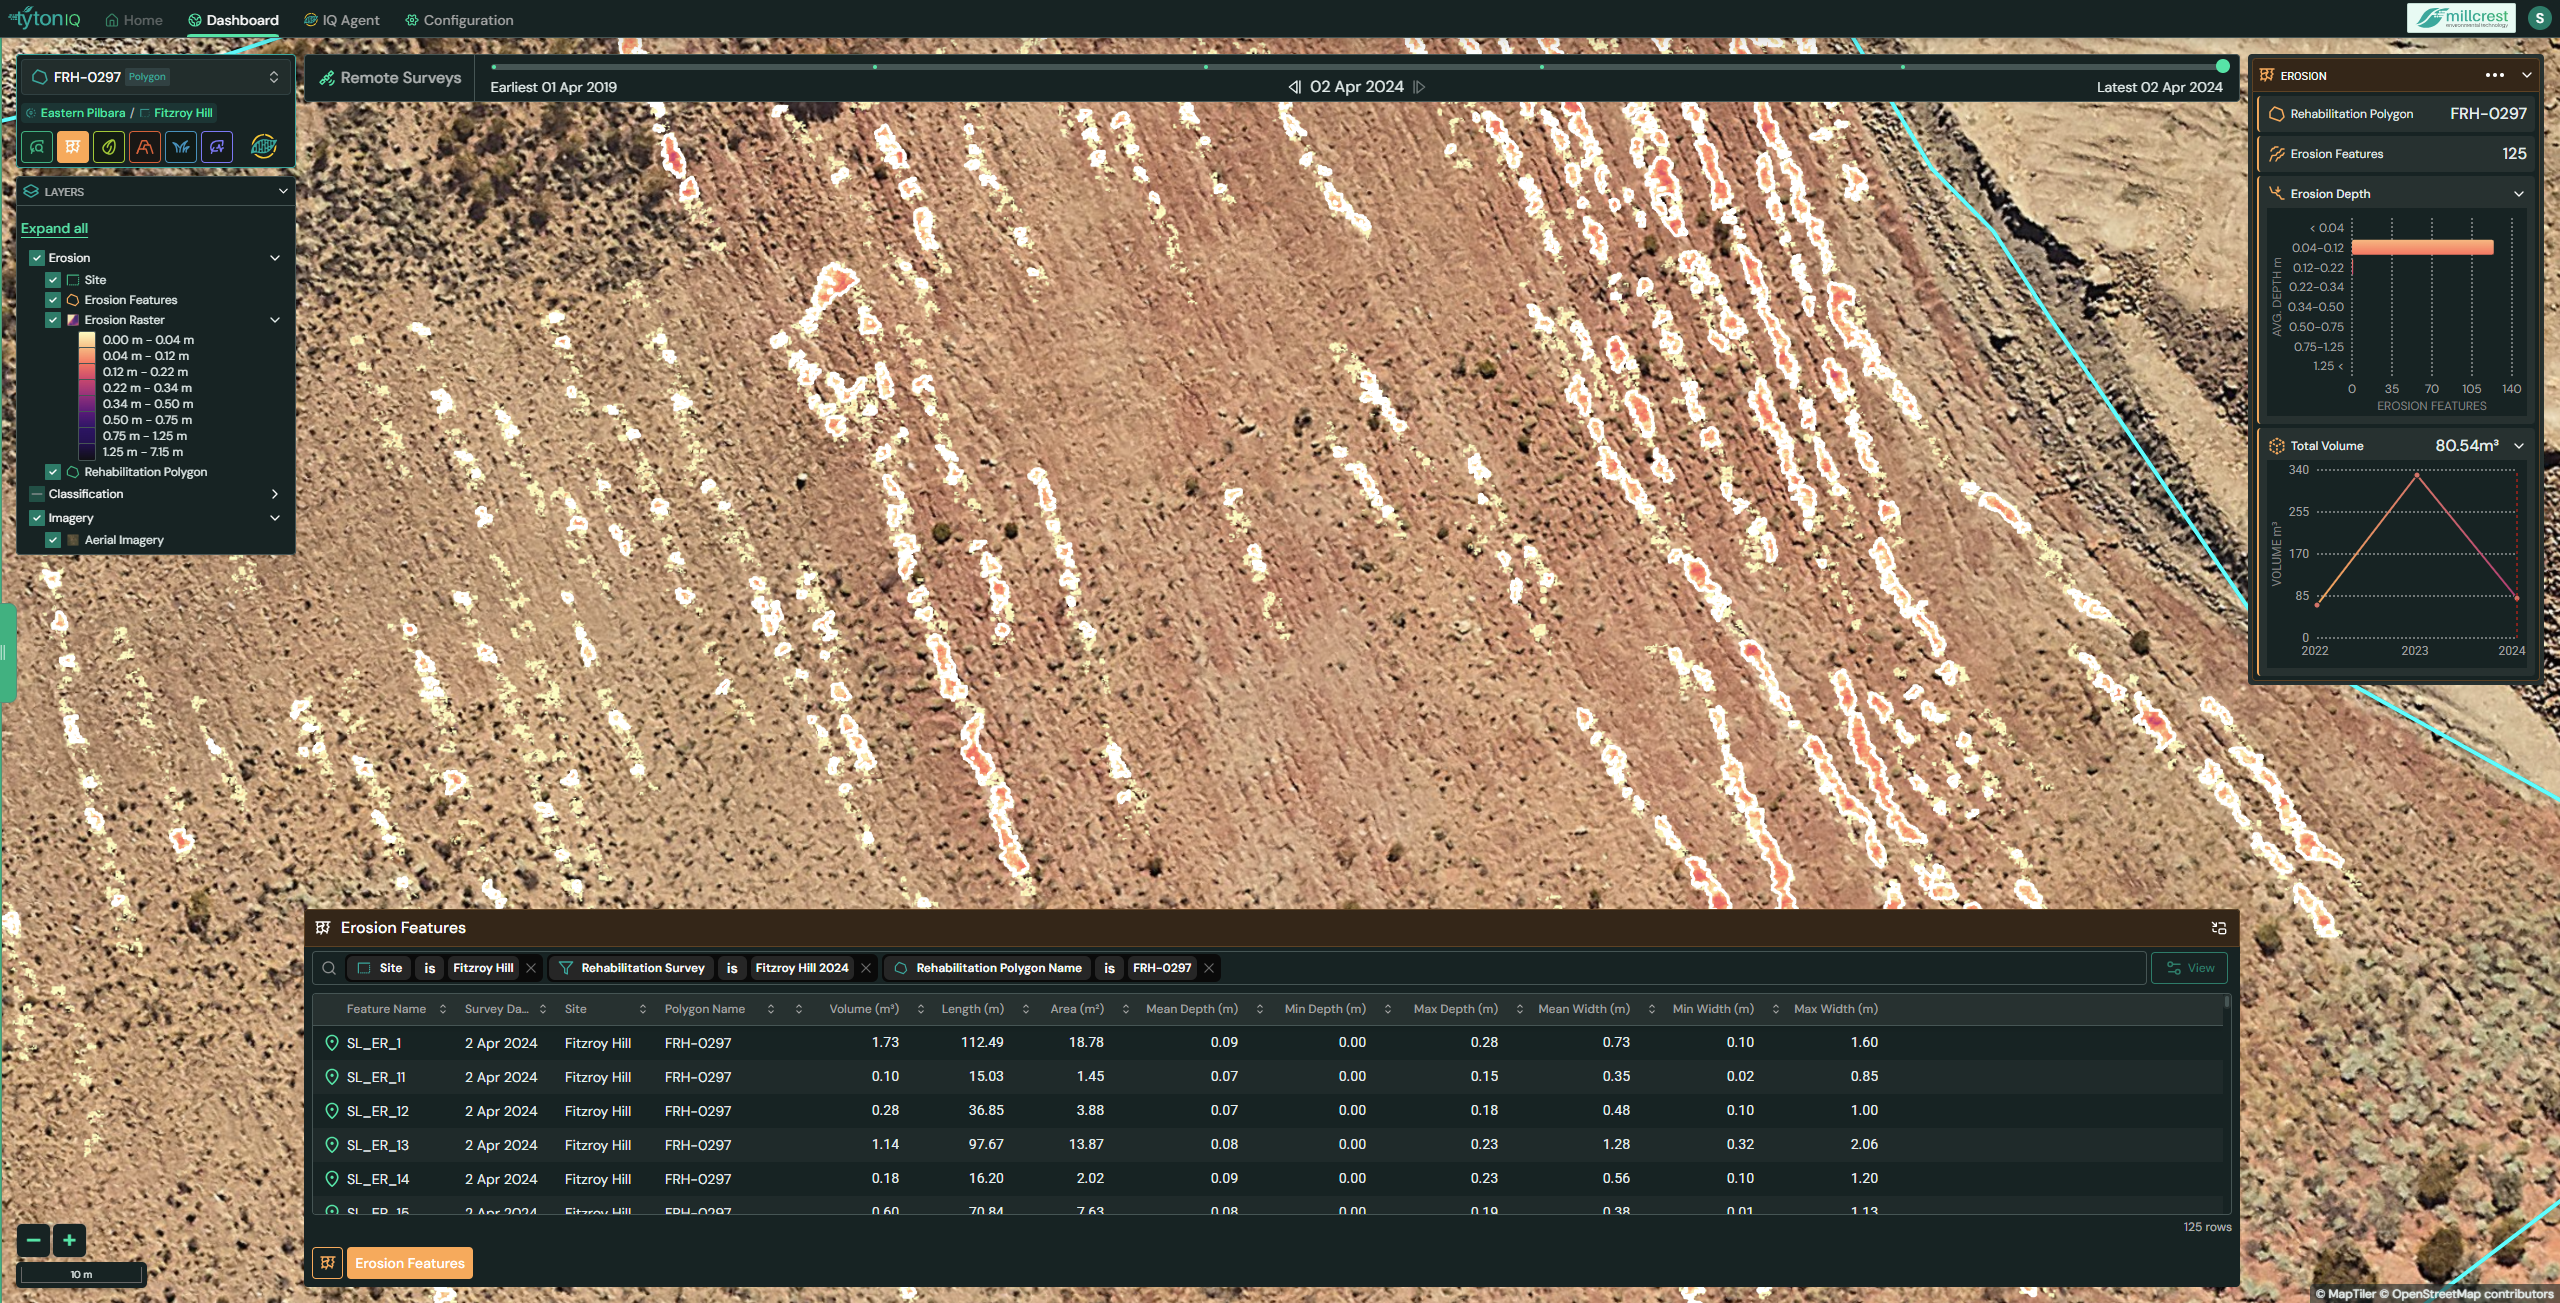
2. Polygon-Level Erosion Summary (Right Sidebar)
When a polygon is selected, the right-hand panel provides an overview of all erosion features within that boundary:
- Rehabilitation Polygon: Identifier (e.g. FRH-0297).
- Erosion Features: Count of features detected (e.g. 125).
- Erosion Depth Distribution: Histogram showing number of features by depth class.
- Total Volume: Combined erosion volume across the polygon (e.g. 80.54 m³).
- Volume Trend Chart: Graph showing erosion volume change over time (e.g. 329.68 m³ in 2023 declining to 80.54 m³ in 2024).
This summary enables monitoring of erosion progression and rehabilitation effectiveness at a landscape scale.
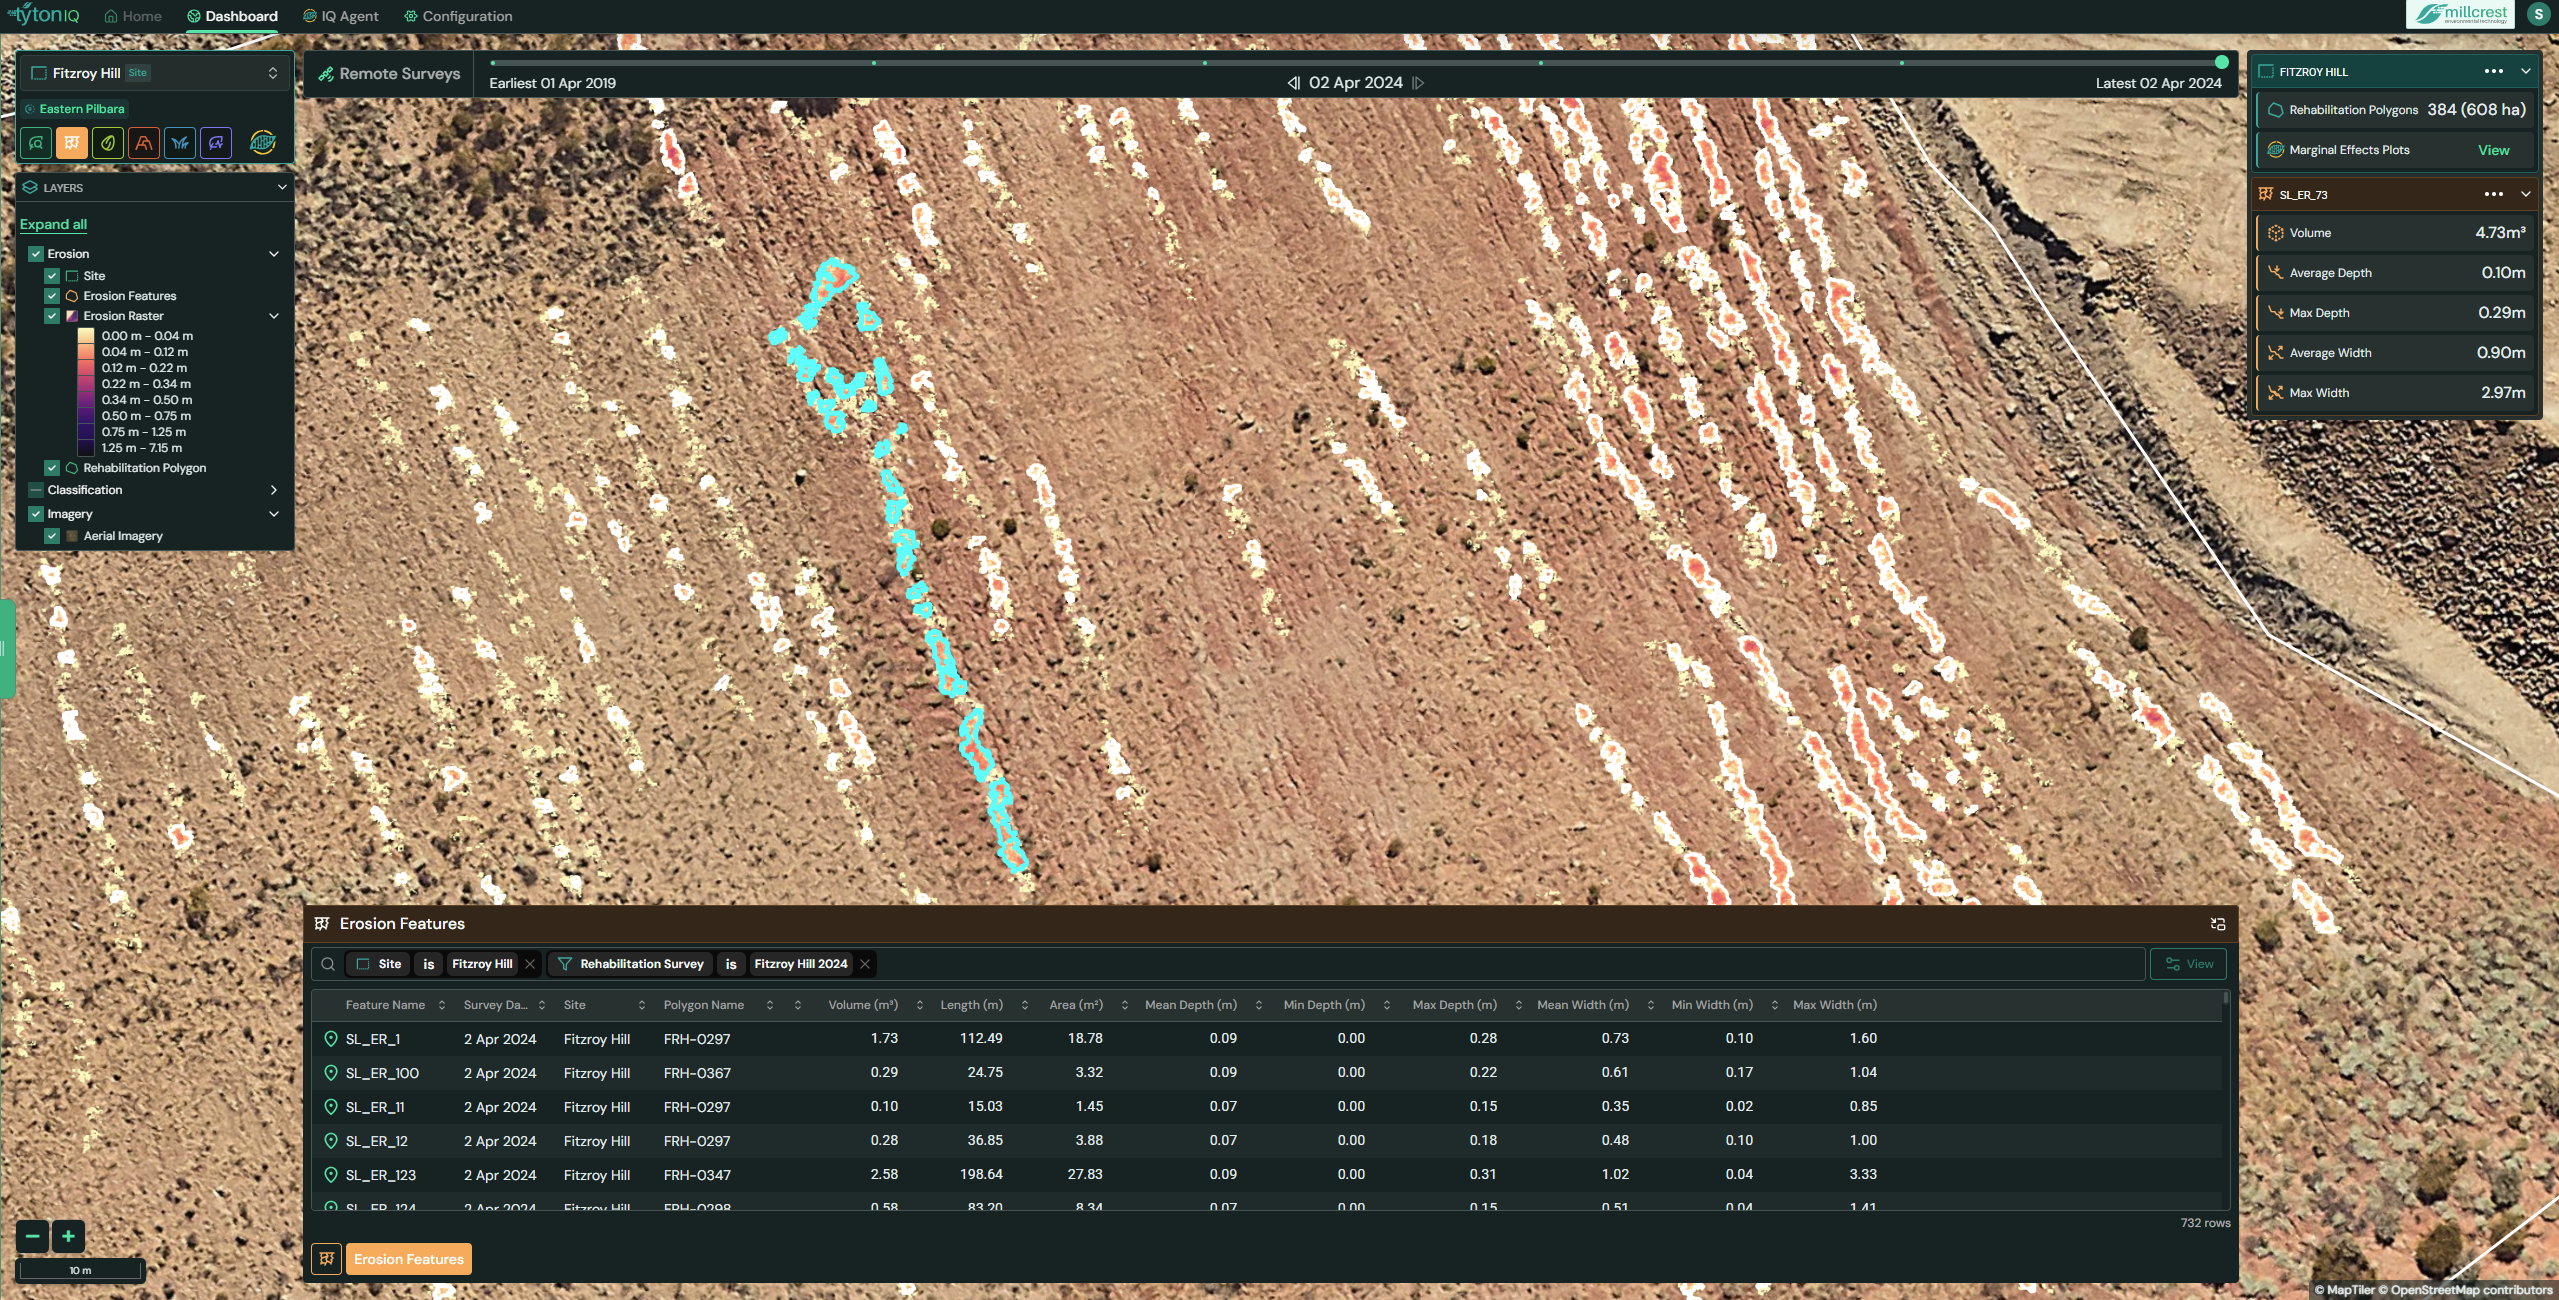
3. Individual Erosion Feature Details
When a specific erosion feature is selected on the map, it is highlighted in cyan and detailed measurements are shown in the right-hand panel:
- Feature ID: Unique identifier (e.g. SI_ER_73).
- Volume (m³): Estimated soil loss for the feature (e.g. 4.73 m³).
- Average Depth (m): Mean erosion depth (e.g. 0.10 m).
- Max Depth (m): Maximum recorded depth (e.g. 0.29 m).
- Average Width (m): Mean feature width (e.g. 0.90 m).
- Max Width (m): Maximum feature width (e.g. 2.97 m).
This detailed breakdown supports prioritisation of erosion control measures on critical features.
4. Erosion Features Table (Bottom Panel)
The Erosion Features table provides a searchable, sortable list of all identified features within a polygon. Core data fields include:
| Field | Description |
|---|---|
| Feature Name | Unique identifier for the erosion feature. |
| Survey Date | Date of imagery analysis. |
| Site | Project site. |
| Polygon | Rehabilitation polygon containing the feature. |
| Volume (m³) | Total erosion volume of the feature. |
| Length (m) | Length of the erosion scar. |
| Area (m²) | Area impacted by erosion. |
| Mean Depth (m) | Average erosion depth. |
| Min Depth (m) | Minimum depth recorded. |
| Max Depth (m) | Maximum depth recorded. |
| Mean Width (m) | Average width of the feature. |
| Max Width (m) | Maximum width recorded. |
Usage Scenarios
- Erosion Monitoring: Track progression of erosion over time at both feature and polygon level.
- Rehabilitation Assessment: Identify areas where erosion control measures are required.
- Compliance & Reporting: Provide quantitative evidence of soil stability improvements.
- Risk Management: Prioritise intervention on high-volume or deep erosion features.