Health Grids
Overview
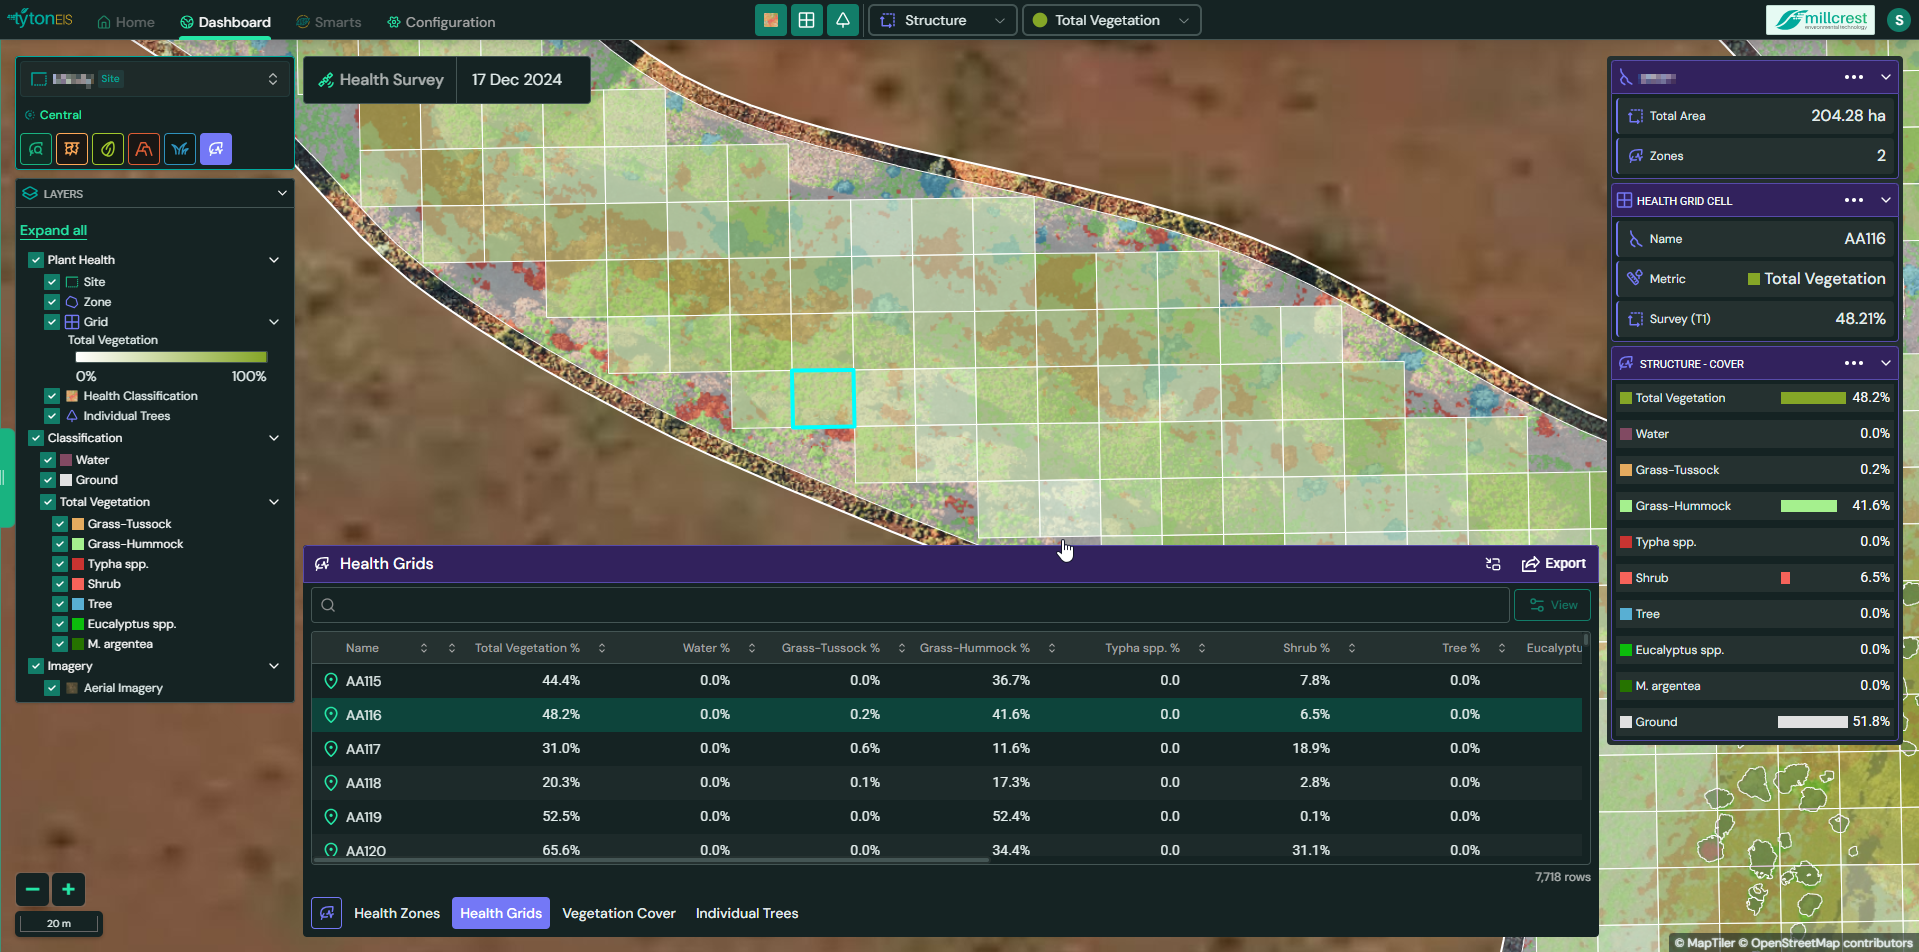
The Health Grids module in TytonIQ offers a granular, cell-by-cell view of vegetation composition and structural data within a defined monitoring zone. This feature supports fine-scale ecological analysis, restoration monitoring, and decision-making at the sub-zone level by dividing areas into uniform grid cells.
Interface Description
The Health Grids interface overlays a grid across the selected zone, with each cell representing a discrete unit of analysis. Selecting a cell highlights it in blue and reveals associated metrics in the panel and data table below.
Key Interface Components:
- Grid Overlay: Displays cell boundaries over the base imagery to segment the health zone.
- Highlighting: Selected cells are outlined in blue for clear identification.
- Data Table: Lists metrics by cell name (e.g., AA115, AA116), updating dynamically based on grid selection.
- Side Panel Summary: Shows a quick summary of vegetation and structural cover for the active cell.
- Classification Layers: Toggling different classification types updates cell coloring based on selected vegetation categories.
Columns and Data Fields
Each grid cell row in the table includes:
- Cell Name: Unique identifier for the cell (e.g., AA115).
- Total Vegetation %: Proportion of the cell covered by vegetation.
- Water %, Ground %, Tree %, Shrub %: Custom class percentages relevant to the monitoring site.
- User-defined Vegetation Types (e.g., Eucalyptus spp., M. argentea, Typha spp.): Fully configurable per project.
- GDV Canopy Area (m²): Total canopy surface area.
- GDV Mean Diameter (m): Average canopy diameter within the cell.
- GDV Max Diameter (m): Largest single canopy diameter observed.
- GDV Mean Height (m): Average vegetation height.
- GDV Max Height (m): Tallest vegetation detected.
Functionality
- Cell Selection: Clicking on a grid cell displays detailed metrics specific to that location.
- Dynamic Updates: Selecting different classifications changes the cell coloring to match classification-specific color schemes.
- Layer Controls: Enable or disable classifications like Water, Ground, Trees, or custom vegetation types.
- Visual Syncing: The Layers panel provides context to the visible classification color schemes.
- Export Options: Data for health grids can be exported in CSV or shapefile format for external use.
Example Use Cases
- Monitoring canopy recovery in targeted restoration areas.
- Comparing vegetation density between different cells for localised intervention.
- Mapping invasive species or bare areas at high spatial resolution.
- Tracking change over time by comparing metrics across survey dates.
Conclusion
Health Grids enable high-resolution ecological insights at the cell level, providing essential detail for localised vegetation assessments and restoration planning. With flexible classification, customizable outputs, and visual overlays, the module is a key tool for precise environmental monitoring within TytonIQ.