Vegetation Cover
Overview
The Vegetation Cover view in plant health provides a visual breakdown of vegetation distribution across selected grid cells within a survey area. It is designed to give users an intuitive understanding of vegetation composition through interactive bar charts, supporting ecological assessments and restoration tracking at a glance.
Interface Description
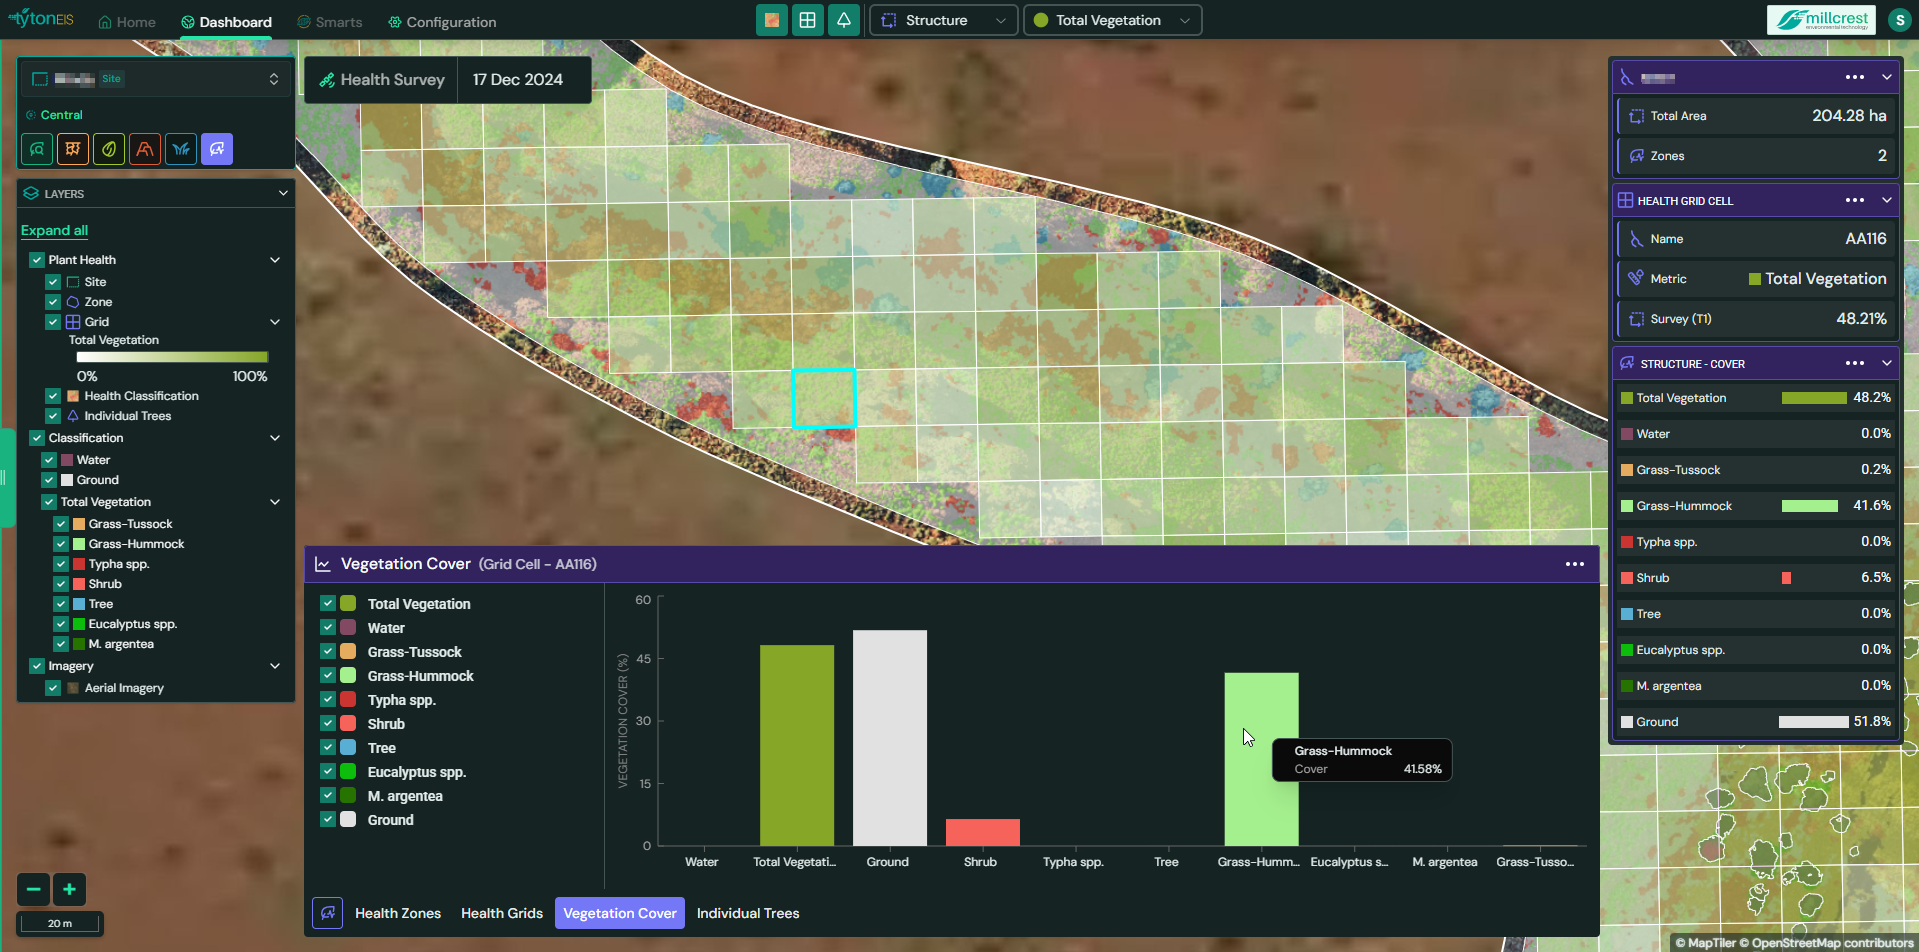
This module is accessible via the Vegetation Cover tab at the bottom of the screen. When a grid cell is selected, a chart is generated to represent the proportional coverage of each classification type for that specific cell.
Key Interface Components:
- Bar Chart Display: A dynamic visual representation of vegetation types, showing their relative proportions within the selected grid cell.
- Legend Panel: Displays all active classification types, each matched with its corresponding color for quick visual reference.
- Toggle Controls: Checkboxes allow users to show or hide individual classification types within the chart.
- Grid Cell Highlighting: Selecting a cell on the map (highlighted in blue) updates the corresponding vegetation cover chart.
- Export Option: A contextual menu in the top right corner of the chart allows users to export the image for reporting or presentation purposes.
Functionality
- Classification-Based Analysis: Users can view how different types of vegetation and ground cover are distributed within a specific grid cell.
- Interactive Chart Controls: Toggle checkboxes to include or exclude specific classes in the visual breakdown.
- Real-Time Updates: Any change in selected grid cells or classifications dynamically updates the chart.
- Layer Integration: Colors and classes are synchronised with the active classification layers visible on the map.
Typical Classifications
- Total Vegetation
- Water
- Ground
- Tree
- Shrub
- User-defined species or categories, such as:
- Grass types
- Aquatic vegetation
- Eucalyptus spp.
- M. argentea
- Typha spp.
These are examples and can be fully customized per project configuration.
Use Cases
- Rapid visual interpretation of vegetation structure within a cell.
- Communicating survey findings through clear graphical outputs.
- Identifying vegetation imbalance or dominance of ground/bare cover.
- Monitoring vegetation changes over multiple survey intervals.
Conclusion
The Vegetation Cover view is a powerful visualization tool in TytonIQ, simplifying complex vegetation data into an accessible, color-coded bar chart. It enhances situational awareness for site managers, ecologists, and stakeholders aiming to understand vegetation dynamics within monitored environments.