Vegetation Cover
Overview
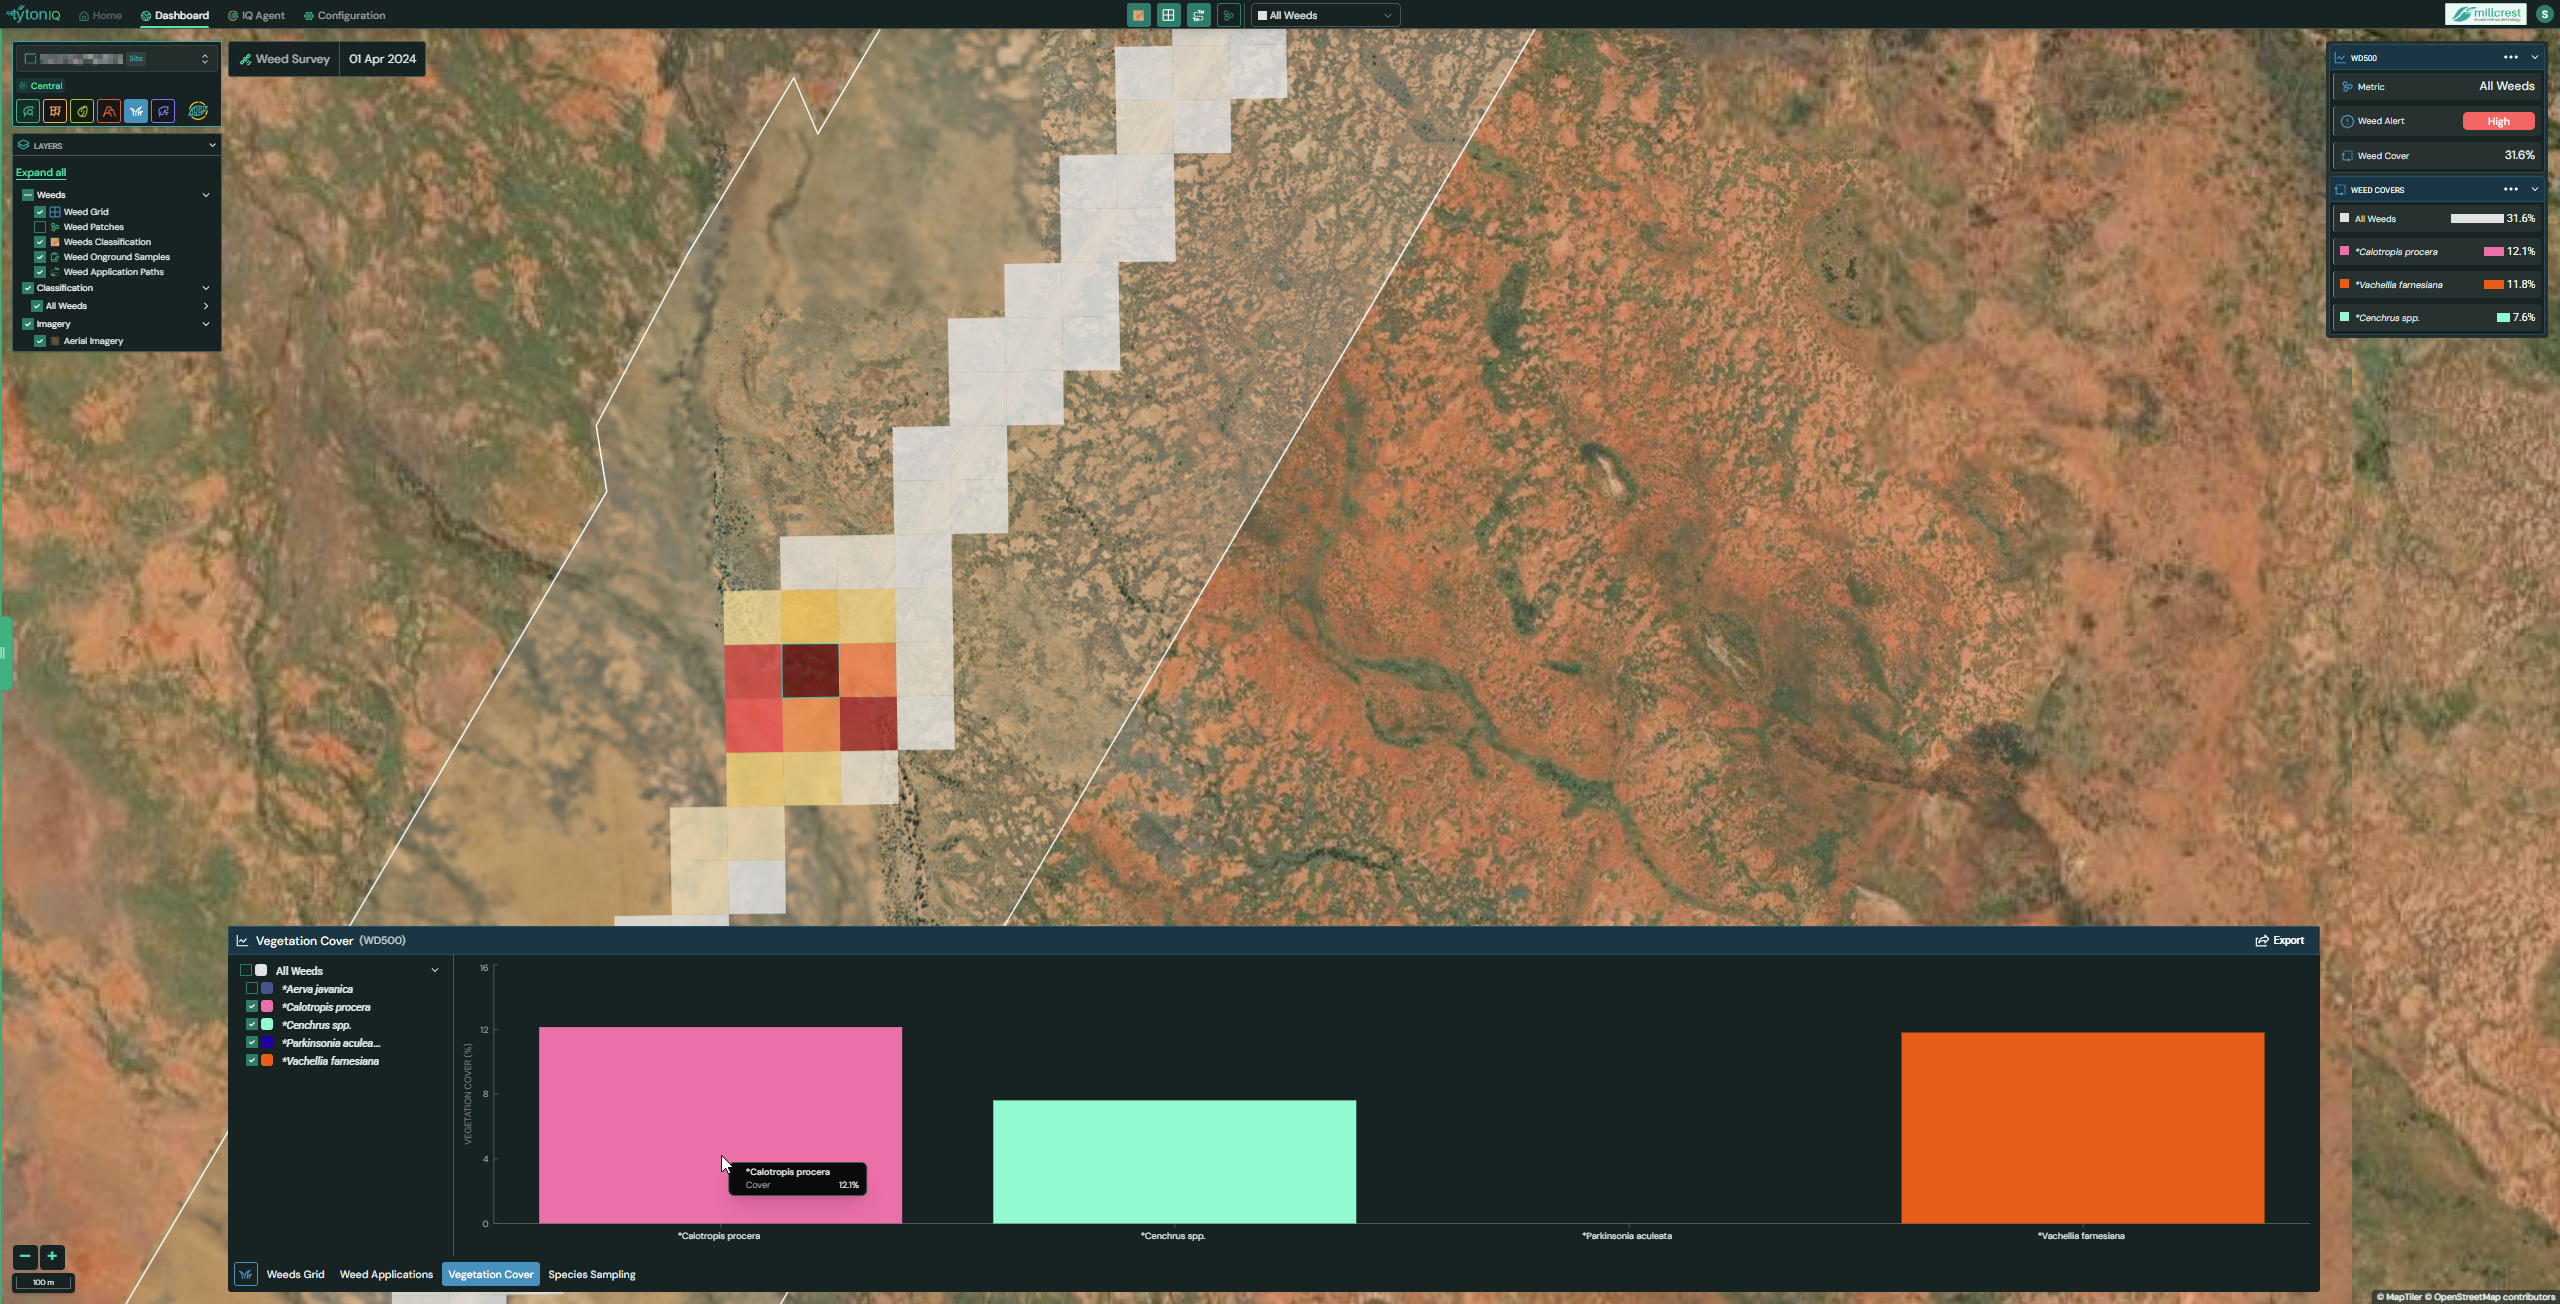
The Weeds Vegetation Cover module in TytonIQ provides a detailed assessment of weed presence and distribution across polygons and survey grids. It enables users to monitor invasive species, quantify weed cover, and track changes over time to support targeted weed management strategies and compliance reporting.
Key Features
-
Weed Classification
- Weed species are grouped into categories defined for the project site.
- Categories can be toggled on or off to focus analysis on individual species or compare across multiple species.
- Weed metrics include total weed cover or species-specific cover percentages.
-
Interactive Cover Graph
- A bar graph displays weed cover percentages by species or groups.
- Hovering over a bar segment shows exact percentage values.
- Multiple species can be compared side by side to assess relative abundance.
-
Map Integration
- Weed survey data is visualised directly on the map as grid layers with intensity heatmaps.
- Areas of higher weed density are highlighted, supporting prioritisation of treatment.
- The right-hand panel displays current weed cover metrics, alerts, and breakdowns by species.
-
Dynamic Filtering
- Users can toggle between All Weeds or focus on individual species.
- Filters allow rapid assessment of high-priority or invasive species.
- Colour-coded layers make it easy to distinguish weed categories across the survey area.
Usage Scenarios
-
Invasive Species Monitoring
Track the extent and spread of invasive weeds across a project area to inform management programs. -
Treatment Effectiveness
Compare weed cover before and after spraying or mechanical removal to evaluate the impact of weed control measures. -
Risk Assessment
Identify areas where weed cover exceeds ecological thresholds, helping to flag polygons requiring urgent intervention. -
Seasonal and Long-Term Trends
Monitor changes in weed prevalence across survey periods to understand seasonal variation and long-term recovery dynamics. -
Species-Specific Analysis
Assess the prevalence of priority species individually (e.g., highly invasive grasses or woody weeds) to support targeted strategies. -
Compliance and Reporting
Use weed cover metrics and exports as part of environmental reporting requirements, ensuring alignment with rehabilitation obligations.
Summary
The Weeds Vegetation Cover module provides a clear and data-driven view of weed distribution across rehabilitation areas and stockpile polygons. By combining map overlays, interactive filtering, and detailed cover percentages, it supports proactive weed management, long-term monitoring, and compliance reporting.