Weeds Grid
Overview
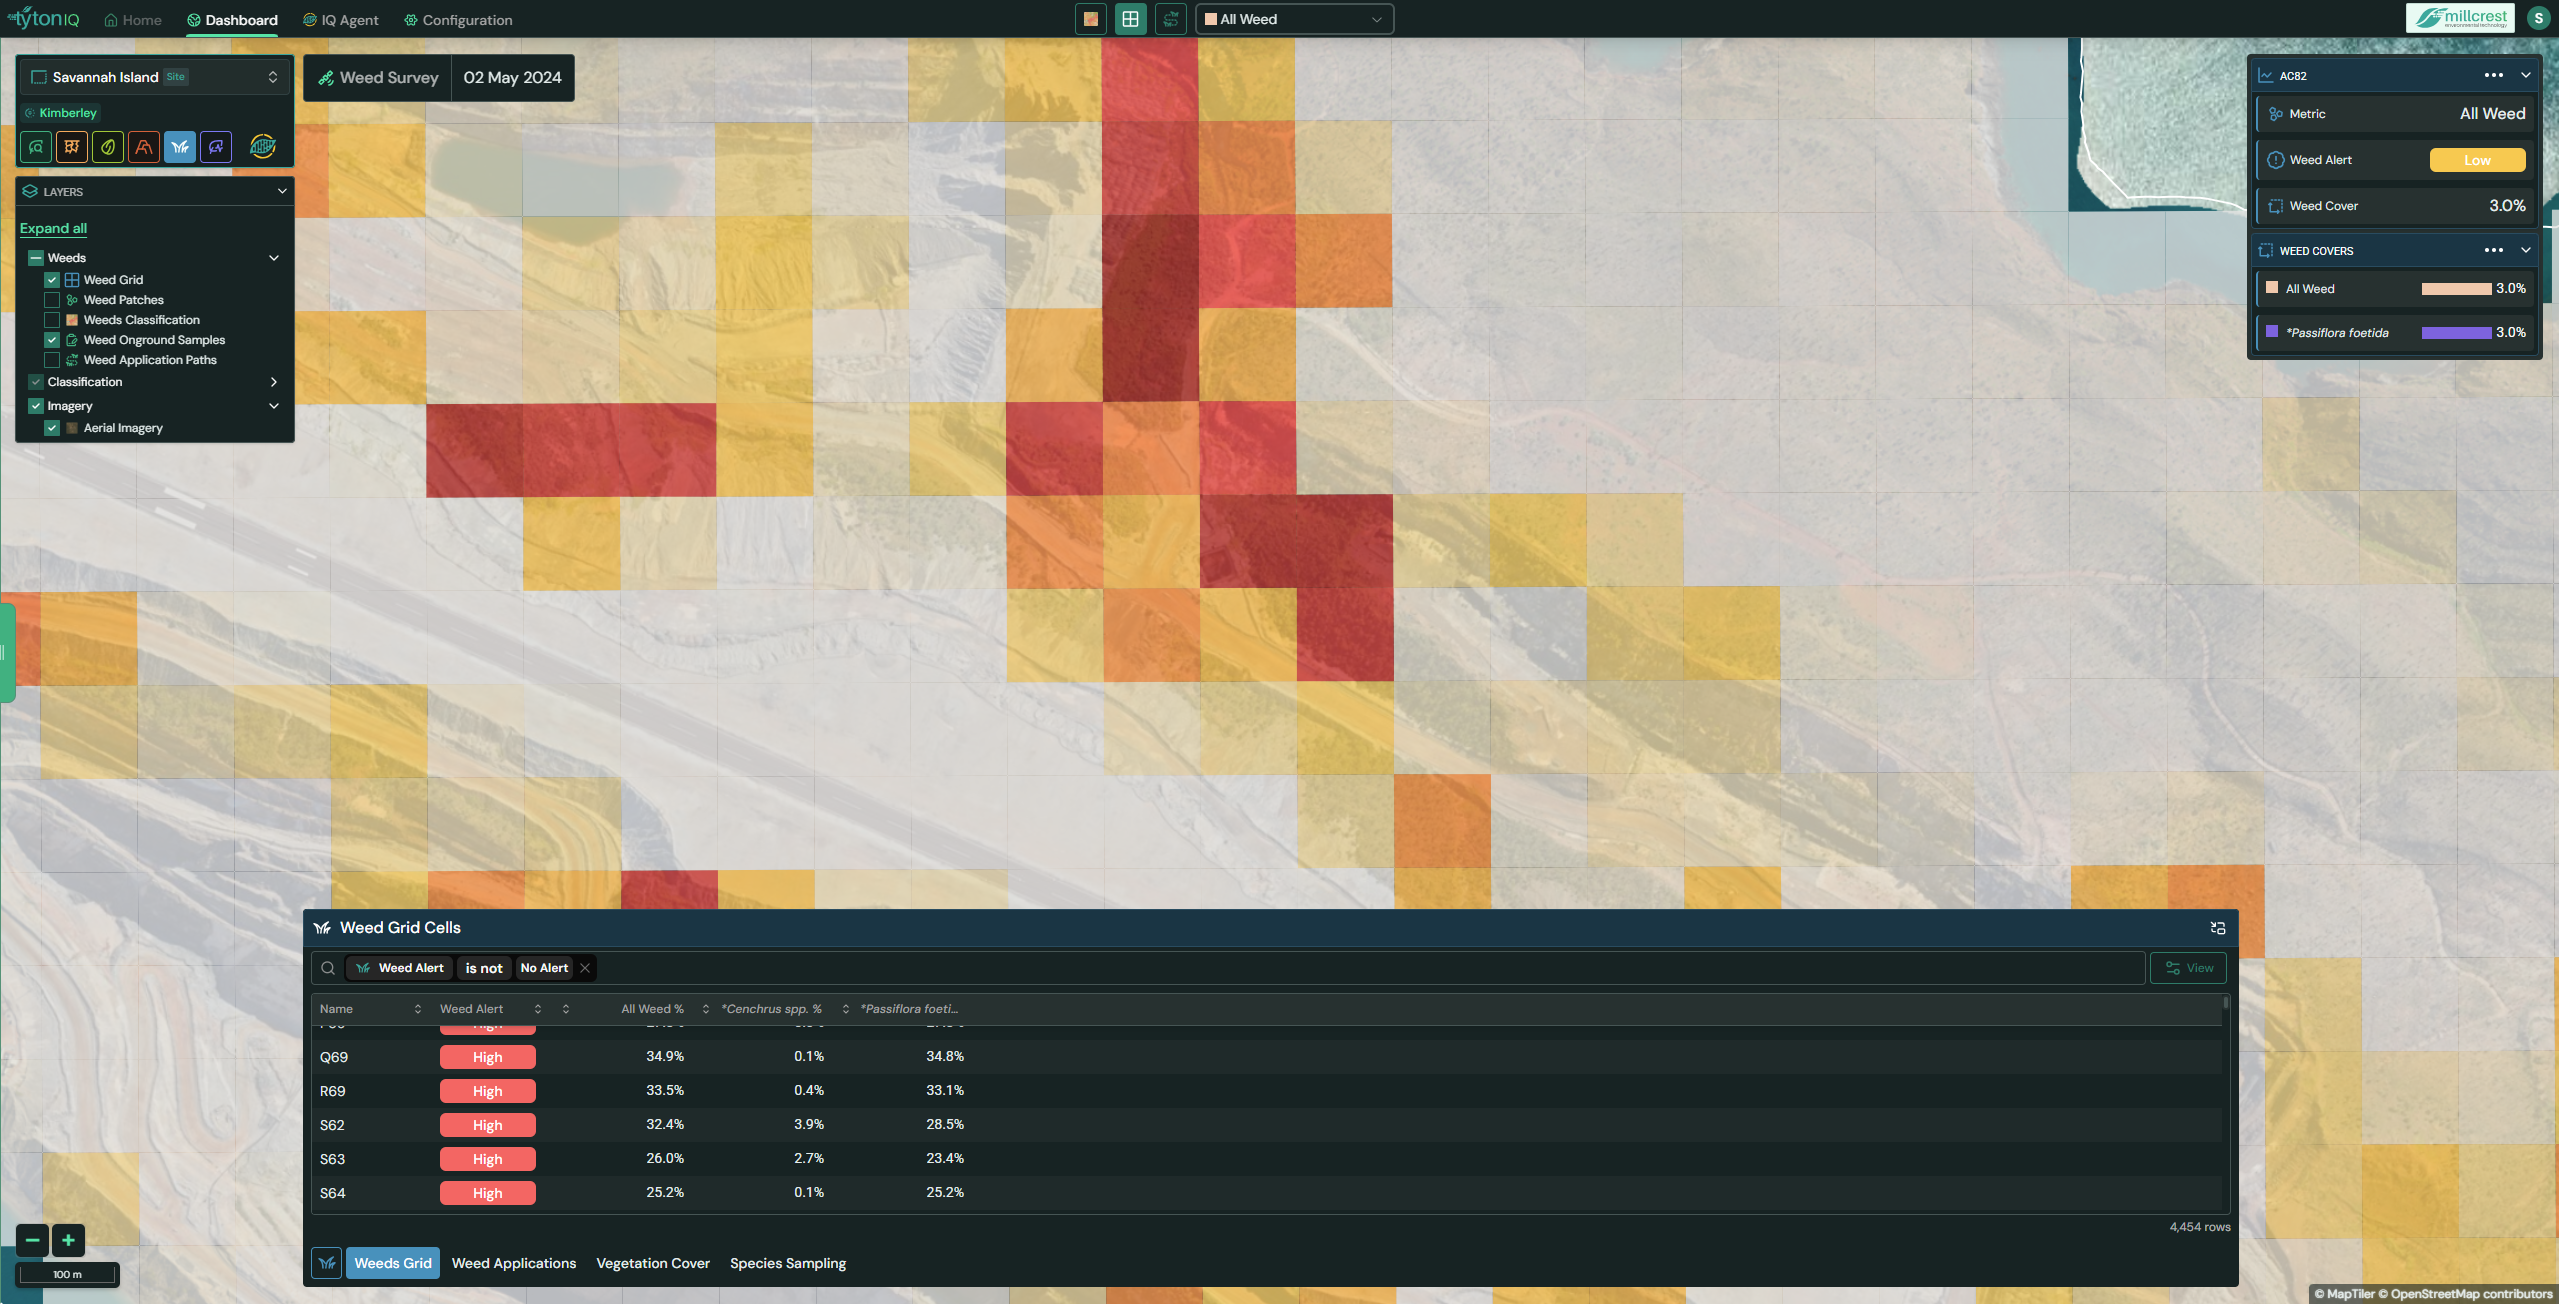
The Weeds Grid overlays a regular grid on the map to visualise weed cover (%) by location. Hotter colours (yellow → orange → red) indicate higher weed cover so you can quickly spot hotspots, prioritise treatment, and measure change over time.
Interface Description
- Species selector (top bar): Switch from All Weed to a specific species. The grid colours and the underlying data update immediately.
- Top-right summary card: Shows the selected cell’s Metric, Weed Alert level, Weed Cover %, and per-species cover when available.
- Bottom drawer – Weed Grid Cells: A sortable, filterable table for every grid cell.
- Layer Toggles:
- Grid overlay — Show or hide the coloured grid that visualises weed cover (%) per cell.
- Classification layer — Show or hide the pixel-level weed classification results on the imagery for visual QA.
- Weed Application Paths — Show or hide the blue lines/points indicating planned or completed treatment tracks (uploaded as shapefiles or vector points).
How to use the grid
-
Choose a weed type
- Use the species dropdown in the top bar.
- Pick All Weed to view overall cover, or select an individual species to target a single weed.
-
Explore the map
- Pan/zoom the map to your area of interest.
- The colour intensity reflects weed cover % for each grid cell (darker = more weeds).
-
Inspect a grid cell
- Click a cell to populate the top-right card with:
- Metric (the selected weed layer),
- Weed Alert (Low/High, etc.),
- Weed Cover % for the current selection,
- Per-species cover when viewing All Weed.
- Click a cell to populate the top-right card with:
-
Work the table
- Open the bottom drawer tab Weed Grid Cells.
- Sort by All Weed % (or a species column) to find hotspots.
- Filter using the chips (e.g., keep only High alerts).
- Click View (if available) to zoom the map to that grid cell.
Switching between Grid & Classification
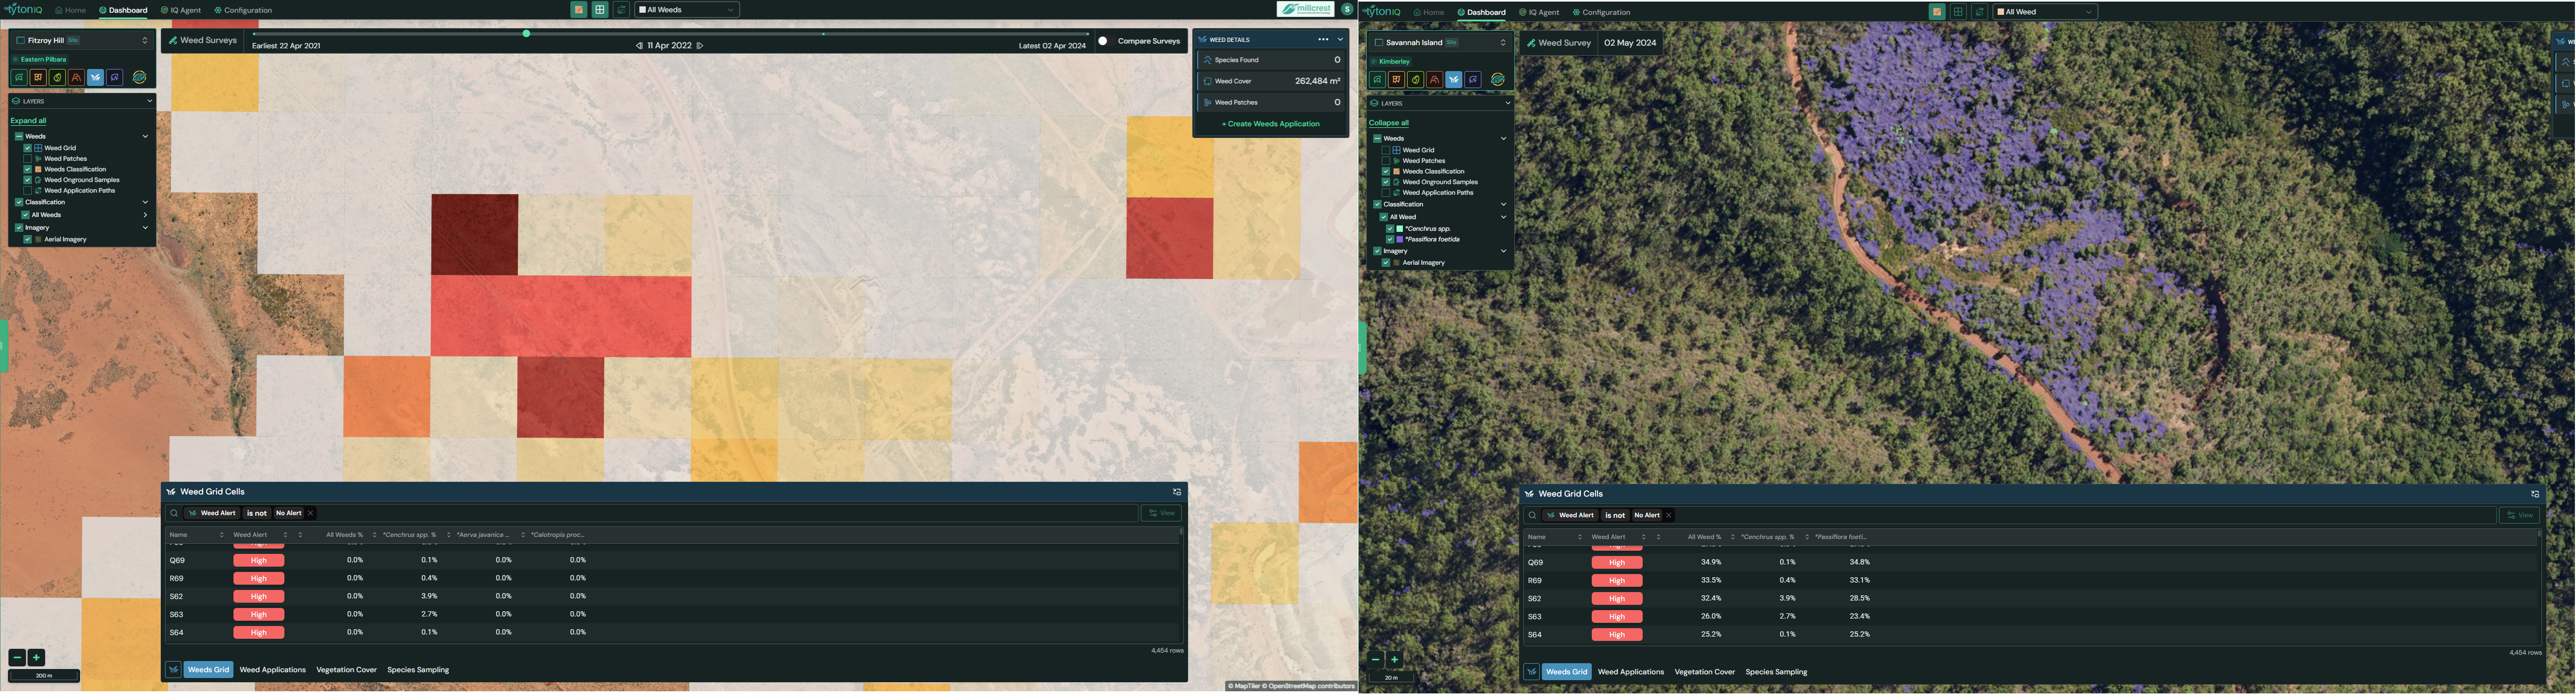
- Show the Grid to get a clean, quantitative view of weed cover by cell.
- Turn off the Grid and turn on the Classification layer to see the classification footprints draped directly over the imagery.
- You can toggle these from the toolbar icons or the LAYERS panel.
Weed Application Paths (blue)
- Blue paths/points represent application tracks—where control/treatment has been (or will be) carried out.
- These can be loaded as shapefiles (lines/polygons) or vector points, and are helpful to:
- Check whether planned or completed applications intersect high-cover cells.
- Validate effectiveness by comparing post-treatment grids.
Typical workflow
- Screen the site with All Weed to locate broad hotspots.
- Target a priority species from the dropdown to refine where treatment is most needed.
- Sort/filter the Weed Grid Cells table to build an actionable list.
- Overlay application paths and/or classification to plan and validate treatment.
- Re-survey in future and compare grid statistics to measure treatment outcomes.
Tips
- Use species-specific mode before planning a targeted spray to avoid over- or under-treating.
- Save time by filtering the table to High alerts only when scoping field work.
- Turn the Classification layer on while reviewing imagery to validate grid signals in complex terrain.
- Keep application paths visible to avoid retreating already covered areas.