Analogue Polygons
Overview
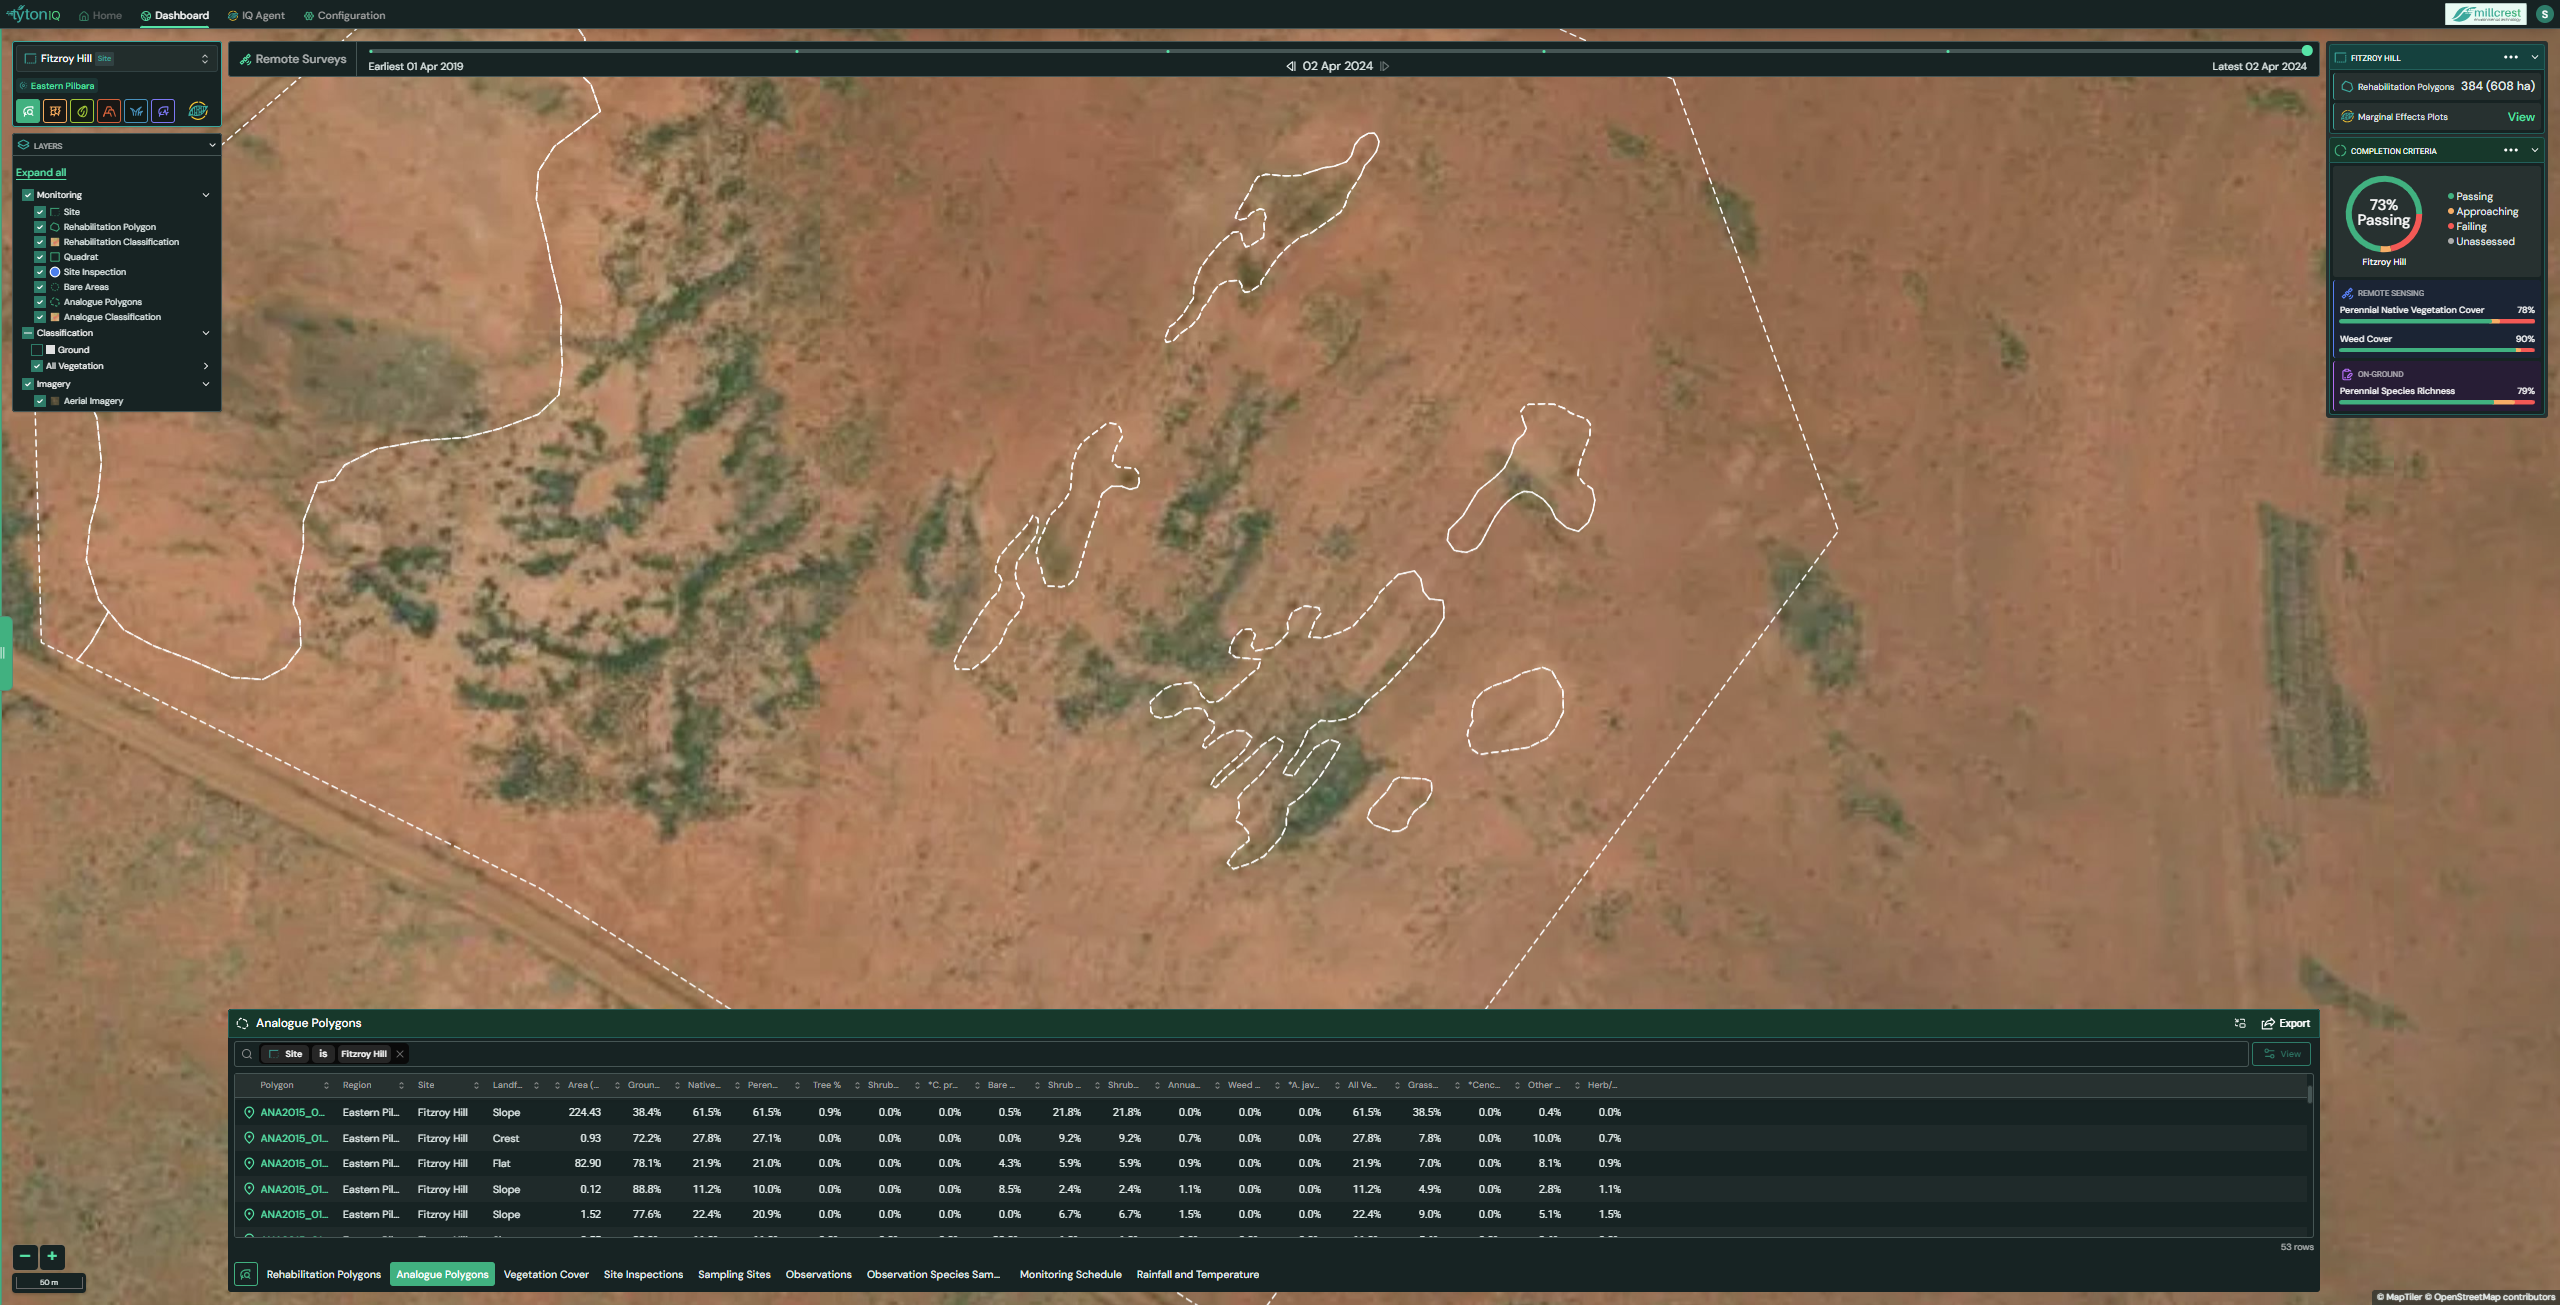
The Analogue Polygons module in TytonIQ allows users to monitor and compare reference sites that represent baseline ecological conditions. These polygons provide a benchmark against which rehabilitation areas can be assessed. The tool integrates spatial visualisation and vegetation metrics, offering insights into analogue ecosystem structure and composition.
Key Features
1. Interactive Filtering and Navigation
Users can refine displayed analogue polygons and data via the following filters:
- Site: Select from available project sites (e.g. Fitzroy Hill).
- Polygon ID: Filter by a specific analogue polygon identifier.
- Date Slider: Navigate survey timelines using the earliest and latest available imagery.
2. Analogue Polygon Data Panel (Right Sidebar)
When an analogue polygon is selected, detailed metadata is displayed in the right-hand panel:
- Type: Polygon classification type (e.g. Analogue).
- Landform: Terrain classification (e.g. Flat, Slope).
- Total Area (ha): Polygon size in hectares.
- Vegetation Cover Wheel: Visual breakdown of vegetation lifeforms and species-specific categories, including:
- Grass-Hummock
- Grass
- Tree
- Shrub-Mallee
- Shrub-Other
- Species groups (e.g. Cenchrus spp., Triodia spp., Acacia spp.).
3. Analogue Polygon Table (Bottom Panel)
The lower panel displays a searchable table of analogue polygon entries. Key data fields include:
| Field | Description |
|---|---|
| Polygon ID | Unique analogue polygon identifier |
| Region / Site | Location context (e.g. Eastern Pilbara, Fitzroy Hill) |
| Landform | Terrain category (e.g. Flat, Slope) |
| Area (ha) | Polygon size in hectares |
| Vegetation Metrics | % cover for Ground, Native, Perennial, Tree, Shrub, Grass-Hummock, Grass, Shrub-Mallee, Shrub-Other |
| Species-specific Metrics | % cover for indicator species (e.g. Cenchrus spp., Triodia spp., Acacia spp.) |
| Other Indicators | Additional vegetation classes or attributes recorded at analogue sites |
The table view can be toggled using the View button in the upper-right corner, or exported for offline use.
4. Data Export
Click the Export button in the top-right of the bottom drawer to download:
- CSV Files for reporting and analysis.
- Shapefiles for GIS integration.
Usage Scenarios
- Baseline Comparison: Establish ecological benchmarks for rehabilitation monitoring.
- Vegetation Assessment: Analyse analogue species composition and structural diversity.
- Audit & Reporting: Export analogue site data to support compliance and research reporting.
- Long-term Monitoring: Track changes in analogue sites over time as a reference for rehabilitation progress.