Rehabilitation Polygons
Overview
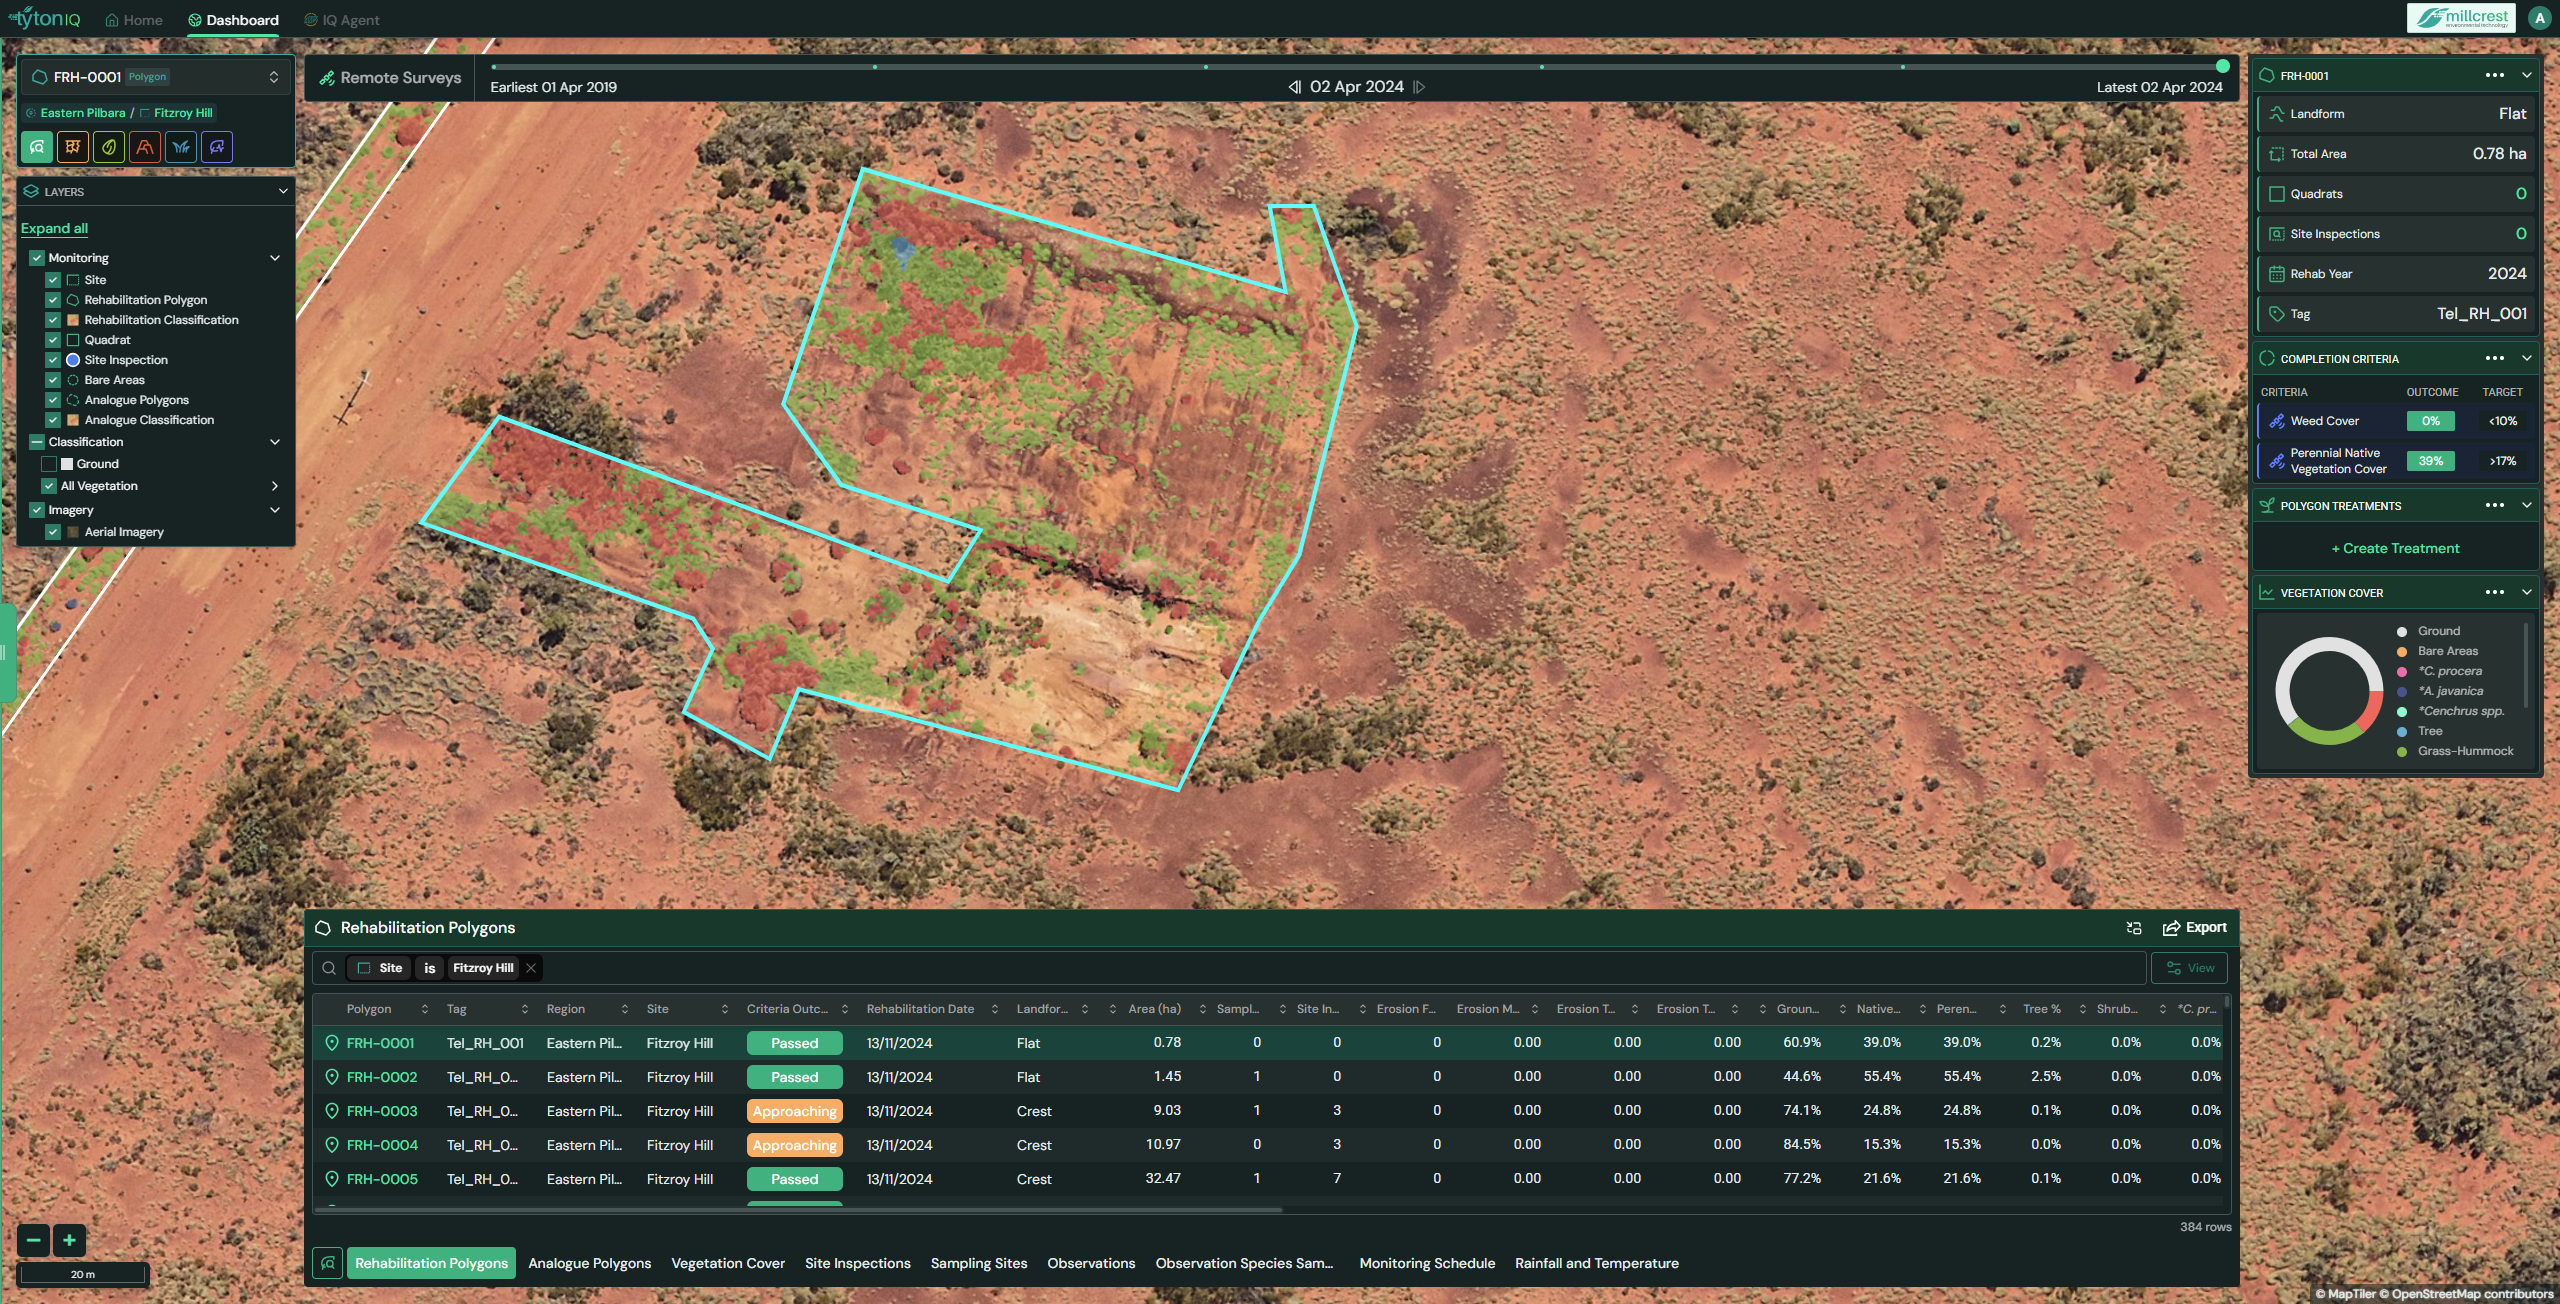
The Rehabilitation Polygons module in TytonIQ enables users to monitor the progress of rehabilitated mine or land management areas. This tool integrates spatial visualisation, vegetation metrics, and compliance tracking to provide a comprehensive view of each rehabilitation polygon’s condition.
Key Features
1. Interactive Filtering and Navigation
Users can refine displayed polygons and data via the following filters:
- Site: Select from available project sites.
- Polygon ID: Filter by a specific polygon identifier.
- Rehabilitation Status: Quickly identify polygons based on whether they passed, failed, or are approaching targets.
- Date Slider: Navigate remote survey timelines using the date range at the top of the map
2. Polygon Data Panel (Right Sidebar)
When a polygon is selected, detailed metadata is displayed in the right-hand panel:
- Landform: Terrain classification (e.g. Flat, Crest, Slope).
- Total Area (ha): Polygon size in hectares.
- Quadrats / Site Inspections: Number of linked inspections.
- Rehabilitation Year: Year polygon was rehabilitated.
- Tag: User-defined or system-generated polygon tag.
- Completion Criteria:
- Weed Cover (% vs. target).
- Perennial Native Vegetation Cover (% vs. target).
- Polygon Treatments: Track seed or chemical treatments applied.
- Vegetation Cover Wheel: Visual breakdown of vegetation lifeforms (e.g. Ground, Bare Areas, Trees, Shrubs, Grass-Hummock, Species-specific categories).
3. Rehabilitation Polygon Table (Bottom Panel)
The lower panel displays a searchable table of polygon entries. Key data fields include:
| Field | Description |
|---|---|
| Polygon ID | Unique polygon identifier |
| Tag | User-defined polygon label |
| Region / Site | Location context (e.g. Eastern Pilbara, Fitzroy Hill) |
| Criteria Outcome | Compliance status (Passed, Failed, Approaching) |
| Rehabilitation Date | Date polygon was rehabilitated |
| Landform | Terrain category (e.g. Flat, Crest, Slope) |
| Area (ha) | Polygon size in hectares |
| Sampling Sites / Inspections | Number of associated inspections |
| Vegetation Metrics | % cover for Ground, Native, Perennial, Tree, Shrub, Grass-Hummock, species-specific categories |
| Erosion Data | Captured erosion indicators |
The table view can be toggled using the View button in the upper-right corner, or exported for offline use.
4. Status Indicators
- 🟢 Passed (Green) – Polygon meets all compliance criteria.
- 🟡 Approaching (Orange) – Polygon partially meets criteria; further monitoring needed.
- 🔴 Failed (Red) – Polygon does not meet required thresholds.
These outcomes are determined based on preset thresholds under Completion Criteria.
5. Data Export
Click the Export button in the top-right of the bottom drawer to download:
- CSV Files for reporting and analysis.
- Shapefiles for GIS integration.
Usage Scenarios
- Environmental Compliance: Track whether each polygon meets site-specific rehabilitation criteria.
- Vegetation and Erosion Assessment: Use coverage data to monitor growth trends and degradation.
- Rehabilitation Auditing: Export polygon data to support internal and external auditing processes.
- Field Coordination: Match polygons to inspection schedules or seed applications.