Site Inspections
Overview
The Site Inspections module in TytonIQ enables users to capture, monitor, and review ecological conditions directly on rehabilitation polygons. Each inspection records field observations, management recommendations, and photographic evidence. This module links ground-truth inspections with remote sensing metrics, making it critical for assessing rehabilitation performance against ecological completion criteria.
Key Features
1. Interactive Filtering and Navigation
Users can refine displayed site inspections and data records using multiple filters in the bottom panel:
- Name: Unique inspection identifier.
- Site: Project site.
- Region: Broader geographical zone.
- Polygon: Rehabilitation polygon ID.
- Category: Inspection type (e.g. Bare Areas, Grass-Hummock, Weed).
- Observation: Field notes describing ecological conditions.
- Recommendation: Suggested management action.
- Observer Name: Inspector conducting the site visit.
- Inspection Date: Date of inspection
- Photos: Linked images included with the inspection.
Filtered results are displayed in the searchable table at the bottom of the interface.
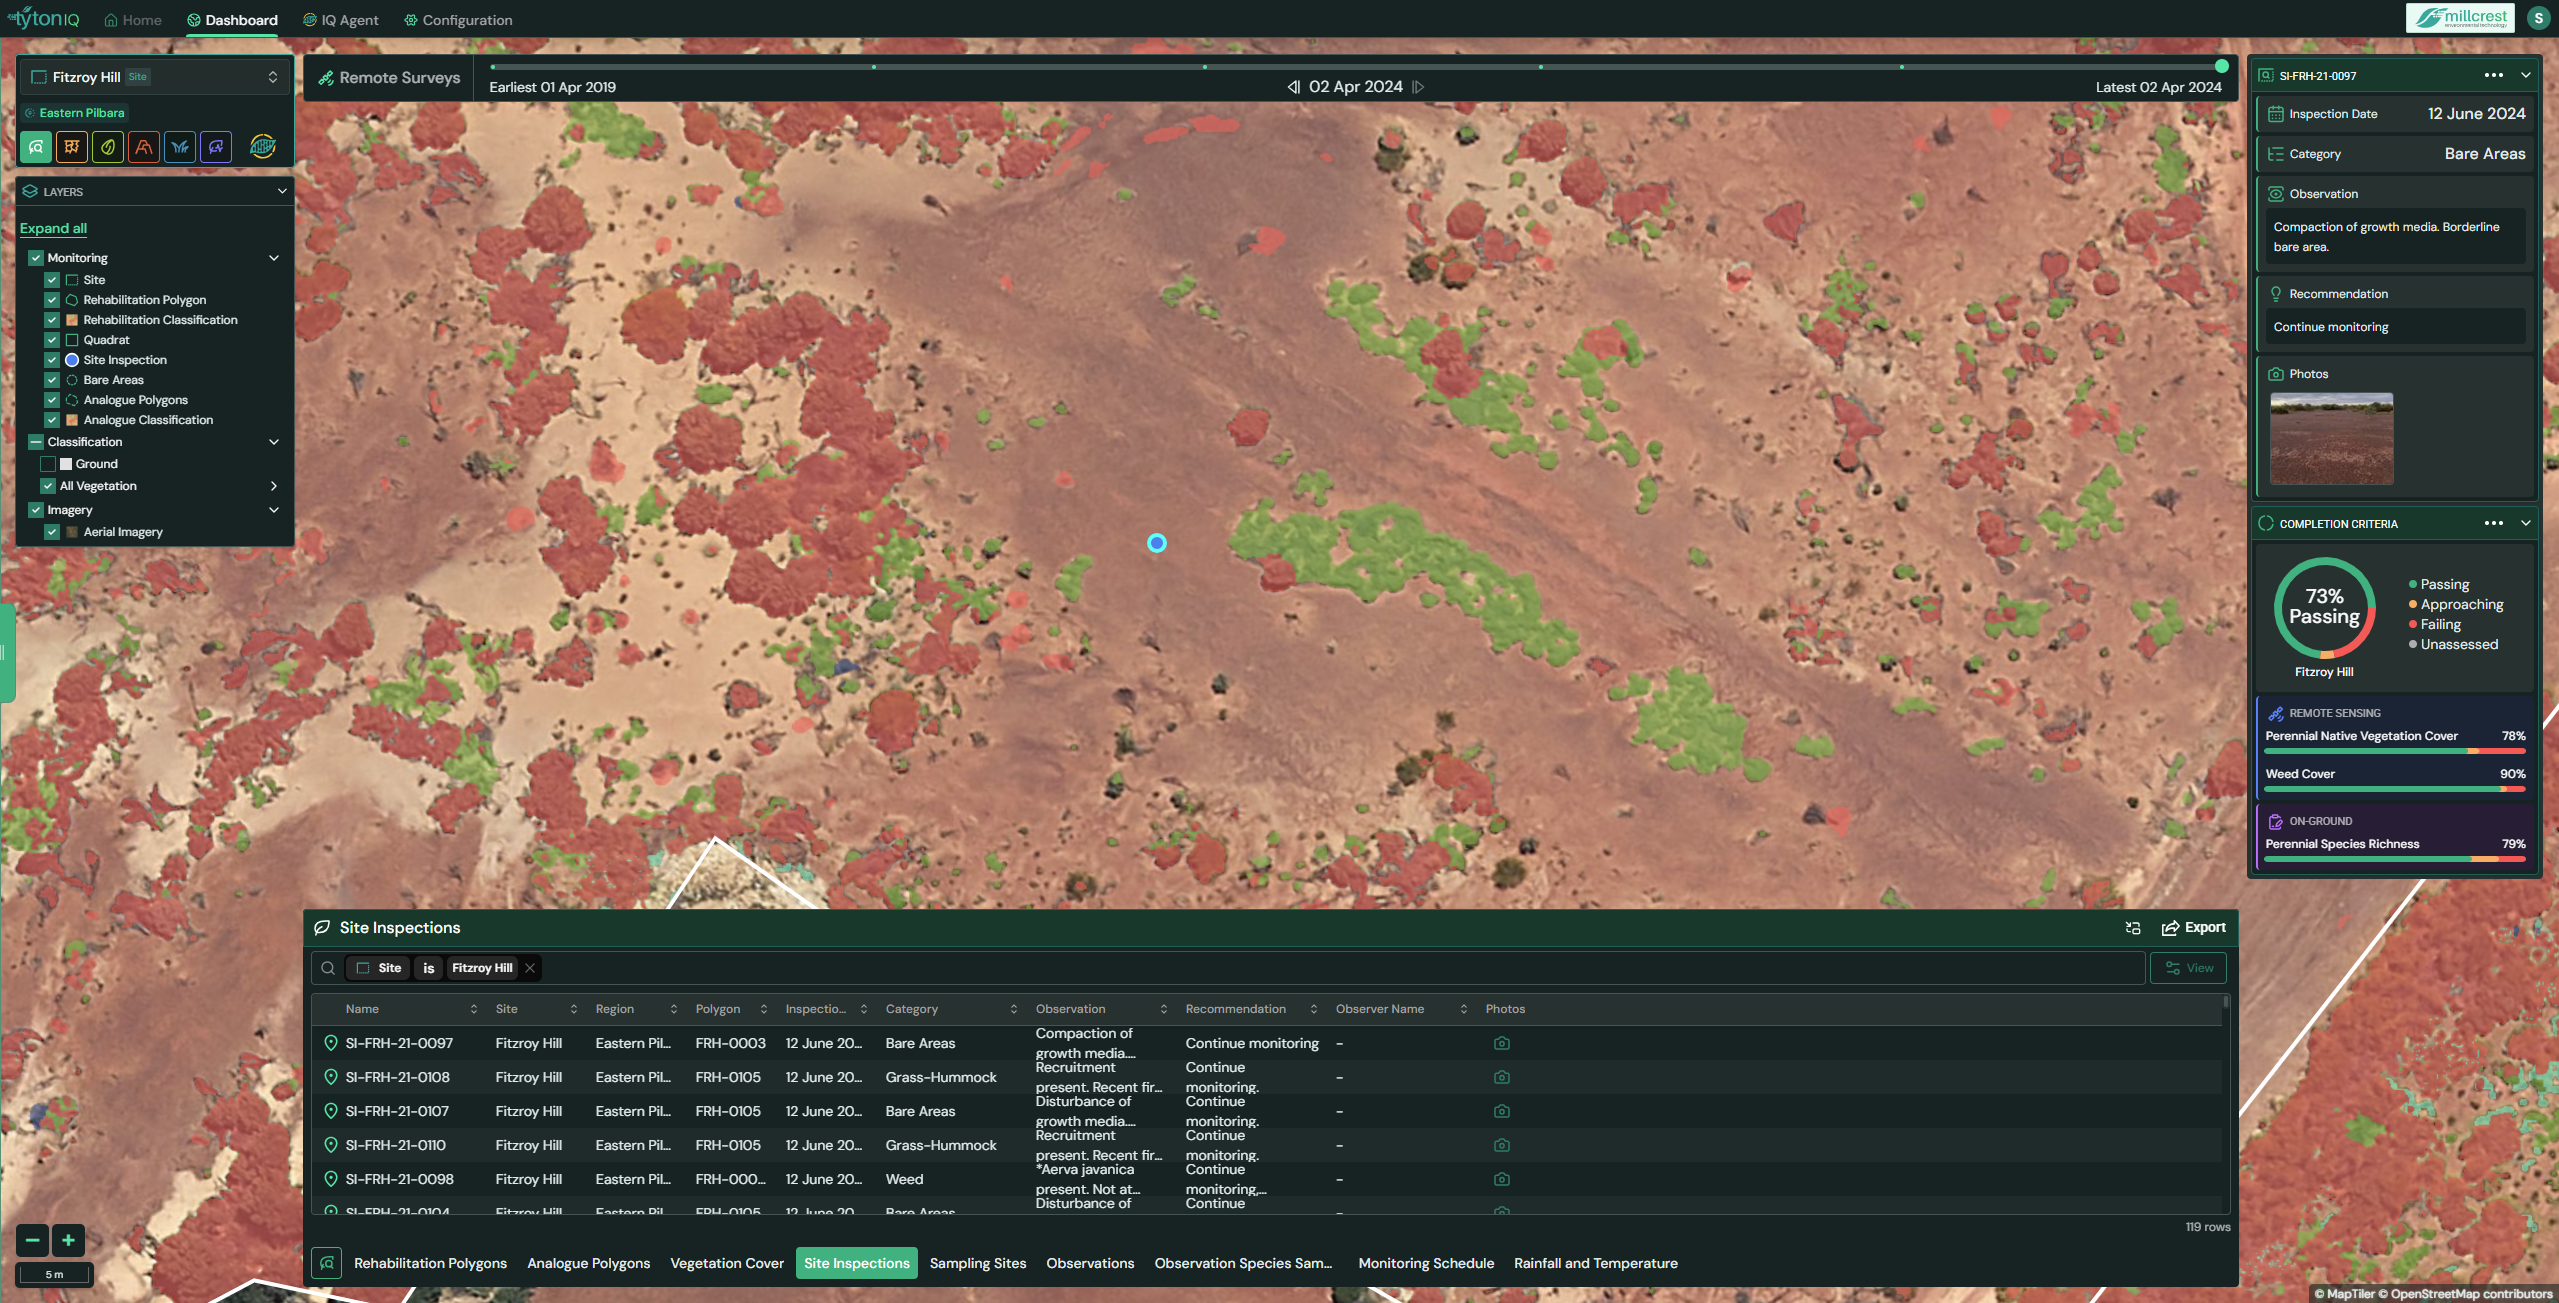
2. Inspection Data Panel (Right Sidebar)
Selecting an inspection opens a detailed panel on the right-hand side, displaying:
- Inspection Date: The field observation date.
- Category: Condition type.
- Observation: Field notes describing site condition
- Recommendation: Suggested management action.
- Photos: Linked inspection imagery for validation.
The panel also summarises completion criteria for the selected site and region, with a colour-coded status indicator:
- 🟢 Passing
- 🟡 Approaching
- 🔴 Failing
- ⚪ Unassessed
3. Completion Criteria & Metrics
Completion criteria and associated metrics are displayed visually in the sidebar:
- Overall Passing Rate %.
- Remote Sensing Metrics:
- Perennial Native Vegetation Cover %.
- Weed Cover %.
- On-Ground Metrics:
- Perennial Species Richness.
These provide a combined view of satellite-derived and field-collected indicators, supporting both operational monitoring and compliance reporting.
4. Site Inspection Table (Bottom Panel)
The bottom panel presents inspection data in a searchable table. Key fields include:
| Field | Description |
|---|---|
| Name | Unique inspection ID. |
| Site | Location name. |
| Region | Regional context. |
| Polygon | Rehabilitation polygon ID. |
| Date | Date of inspection. |
| Category | Land/condition type. |
| Observation | Field notes describing site condition. |
| Recommendation | Suggested management action. |
| Observer | Inspector name. |
| Photos | Linked photo evidence for inspection. |
The table can be toggled using the View button or exported for offline use.
5. Exporting Inspection Data
Users can export inspection records for external reporting and analysis. Supported formats include:
- CSV – structured tabular data.
- Shapefile – GIS-compatible data.
- PNG – map view with inspection overlay.
Usage Scenarios
- Ecological Monitoring: Track rehabilitation progress, vegetation recovery, and weed encroachment.
- Rehabilitation Review: Assess success of seeding, planting, and ground preparation.
- Compliance & Reporting: Generate transparent inspection evidence for regulators and stakeholders.
- Integration with Remote Sensing: Validate satellite data with field-based inspections for robust monitoring.