Vegetation Cover
Overview
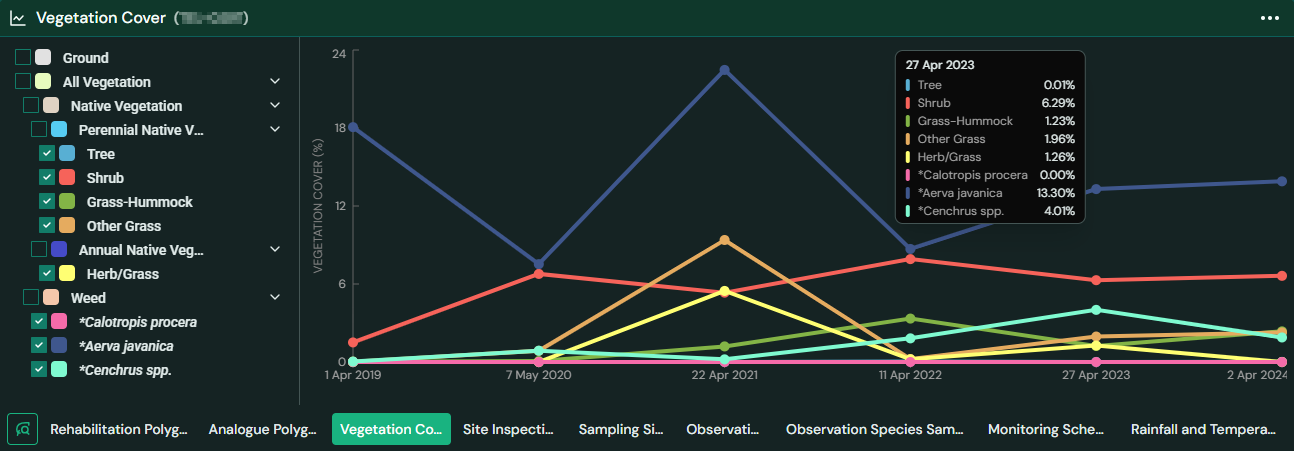
The Vegetation Cover module in TytonIQ enables users to visually analyse changes in vegetation composition over time within selected rehabilitation polygons. It leverages remote survey data to display trends in both native and non-native vegetation, aiding in ecological monitoring and rehabilitation evaluation.
Key Features
1. Interactive Graphical Timeline
- Visualizes vegetation cover over time using a dynamic line chart.
- X-axis: Timeline of remote surveys.
- Y-axis: Vegetation cover percentage (%).
- Each vegetation class is represented by a unique colour and line.
2. Vegetation Class Filtering
-
Users can toggle vegetation types to customize the graph:
- Ground and Water Cover
- Native Vegetation:
- Perennial Native Vegetation
- Tree
- Shrub
- Grass-Hummock
- Other Grass
- Annual Native Vegetation (Herb/Grass)
- Weeds:
- Cenchrus spp.
- Aerva javanica
- Calotropis procera
- Passiflora foetida
- Debris and Bare Areas
-
Selecting or deselecting a checkbox updates the chart in real time.
3. Dynamic Chart Interaction
- Hover over data points to view exact vegetation cover values for a specific class at a given time.
- Toggling multiple classes allows comparison across native vegetation, weeds, and other ground covers.
4. Contextual Integration with Polygon Panel
- Located alongside the polygon information panel.
- Automatically reflects the selected polygon and its associated data.
- Tile view on the right shows current vegetation cover and completion criteria for native cover vs weed cover.
5. Data Export
Click the Export button in the top-right of the bottom drawer to download:
- CSV Files for reporting and analysis.
- PNG for visual imagery.
How to Use
- Select a polygon in the Rehabilitation Polygons module.
- Navigate to the Vegetation Cover tab at the bottom of the screen.
- Toggle vegetation classes of interest on the left panel.
- Analyse vegetation trends over time using the interactive chart.
Usage Scenarios
- Rehabilitation Progress Monitoring: Track how native vegetation improves over the years.
- Weed Invasion Analysis: Assess the spread and percentage of invasive species like Cenchrus spp..
- Ecological Health Review: Evaluate if vegetation criteria targets are being met, as shown in the right-hand polygon completion panel.
- Compliance and Reporting: Use chart exports or visualizations for environmental reporting and regulatory compliance.
Tip
- Toggle fewer categories for a clearer view of trends.
- Zoom into time ranges by clicking and dragging on the graph area (if enabled).
- Ensure regular remote surveys are added to track meaningful long-term changes.