Observations & Species Sampling
Overview
The Observations and Observation Species Sampling modules in TytonIQ provide detailed ecological records collected from established sampling sites. Together, they allow users to document field conditions, capture on-ground metrics (such as species richness), and record species-level measurements. These modules are critical for validating rehabilitation performance, supporting ecological research, and providing evidence for compliance reporting.
Key Features
1. Interactive Filtering and Navigation
Both modules provide filters in the bottom panel to refine displayed data:
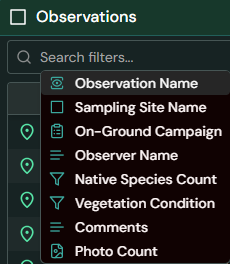
Observations Tab
- Observation Name: Unique identifier (e.g. APS-01-20170528).
- Sampling Site Name: Associated sampling site ID (e.g. APS-01).
- On-Ground Campaign: Survey campaign grouping (e.g. 2017 Fitzroy Hill On-ground Survey).
- Observer Name: Person conducting the observation.
- Native Species Count: Number of species identified.
- Vegatation Condition: Diversity index with thresholds for success.
- Comments: Field notes describing site conditions.
- Photo count: Linked imagery from the inspection.
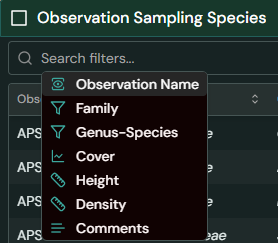
Observation Species Sampling Tab
- Observation Name: Links species data to a specific observation ID.
- Family: Plant family (e.g. Fabaceae).
- Genus–Species: Scientific name (e.g. Acacia ancistrocarpa).
- Cover (%): Vegetation cover for the species.
- Height (m): Average plant height.
- Density (plants/ha): Plant density per hectare.
- Comments: Species-level notes (if recorded).
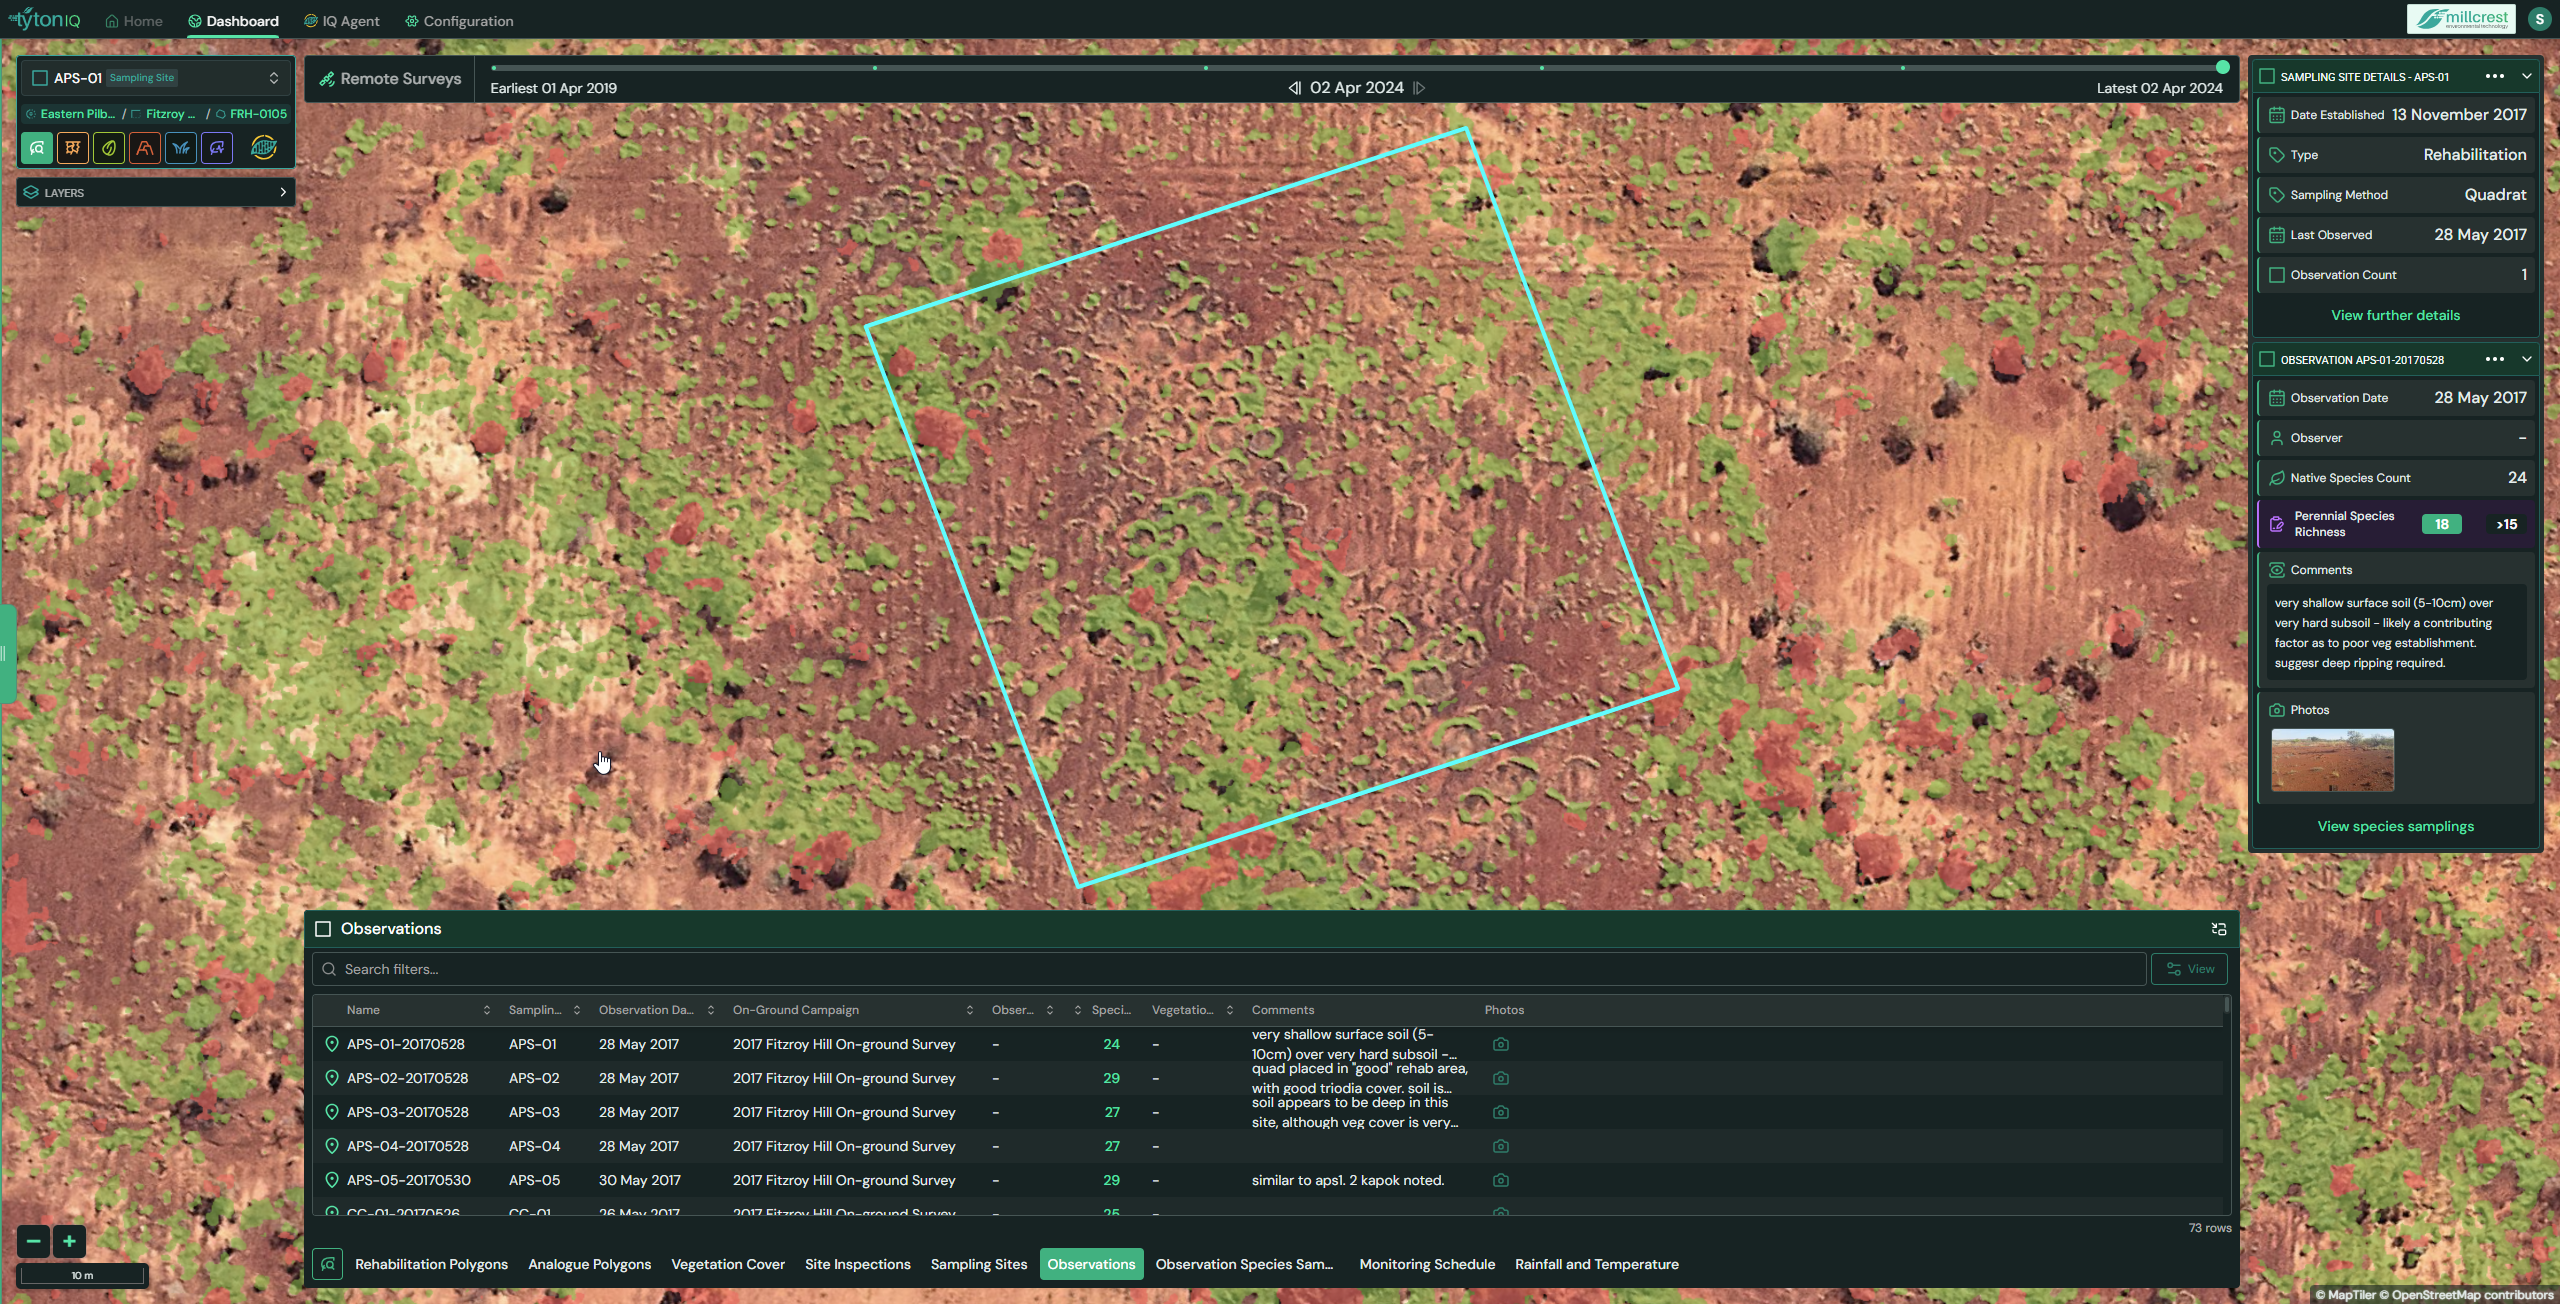
2. Observation Data Panel (Right Sidebar)
When selecting an observation, the right-hand panel displays key details:
- Date Established: Linked sampling site establishment date.
- Type: Rehabilitation or analogue classification.
- Sampling Method: Technique used (e.g. Quadrat).
- Last Observed: Date of most recent survey.
- Observation Date: Date of current observation.
- Observer: Field staff name (if recorded).
- Native Species Count: Total species observed (e.g. 24).
- Perennial Species Richness: Diversity index with passing threshold (e.g. 18 >15).
- Comments: Qualitative notes (e.g. very shallow surface soil (5–10 cm) over hard subsoil, suggesting deep ripping required).
- Photos: Linked inspection images.
From the panel, users can navigate directly to species sampling records for the selected observation.
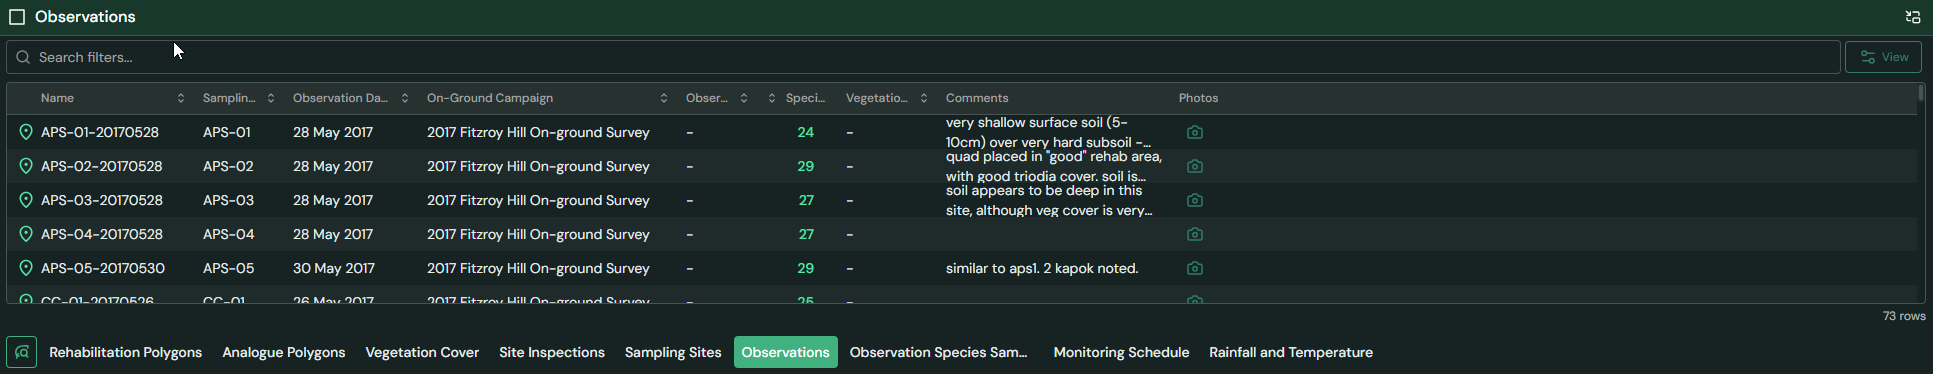
3. Observations Table (Bottom Panel)
The Observations table provides a searchable list of recorded surveys. Key fields include:
| Field | Description |
|---|---|
| Observation Name | Unique identifier linking to sampling site (e.g. APS-01-20170528). |
| Sampling Site | Associated sampling site (e.g. APS-01). |
| Observation Date | Date of field survey. |
| On-Ground Campaign | Campaign grouping (e.g. 2017 Fitzroy Hill Survey). |
| Observer | Person who carried out the observation. |
| Native Species Count | Number of native species recorded. |
| Perennial Richness | Species richness value and threshold (e.g. 18 >15). |
| Comments | Field notes about site conditions. |
| Photos | Linked inspection images. |
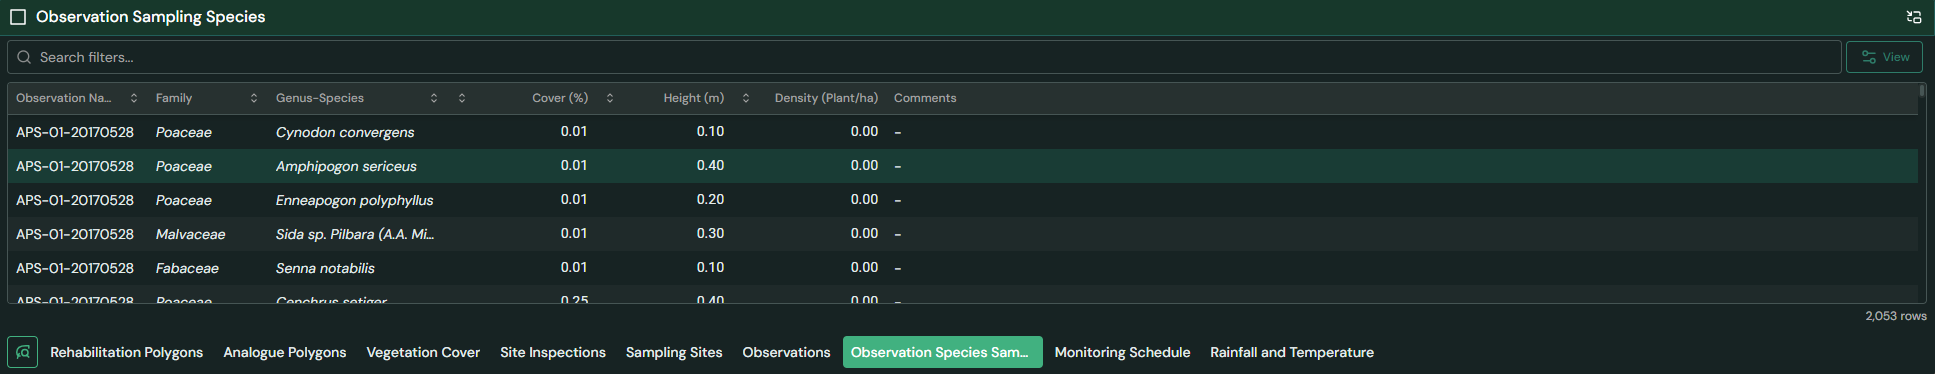
4. Species Sampling Table (Bottom Panel)
The Observation Species Sampling table provides species-level data tied to observations. Core fields include:
| Field | Description |
|---|---|
| Observation Name | Unique ID linking species records to an observation. |
| Family | Taxonomic family (e.g. Fabaceae, Myrtaceae). |
| Genus–Species | Scientific species name. |
| Cover (%) | Vegetation cover as a percentage. |
| Height (m) | Average plant height in metres. |
| Density (plants/ha) | Estimated plant density per hectare. |
| Comments | Species-level notes, if recorded. |
Usage Scenarios
- Ecological Monitoring: Track species composition and diversity changes over time.
- Ground-Truthing: Validate satellite-based vegetation data with field species surveys.
- Rehabilitation Review: Assess establishment success and identify soil or site limitations.
- Compliance & Reporting: Provide detailed, species-level evidence for regulatory submissions.
- Long-Term Baselines: Build multi-year ecological datasets to support restoration science.