Monitoring Schedule
Overview
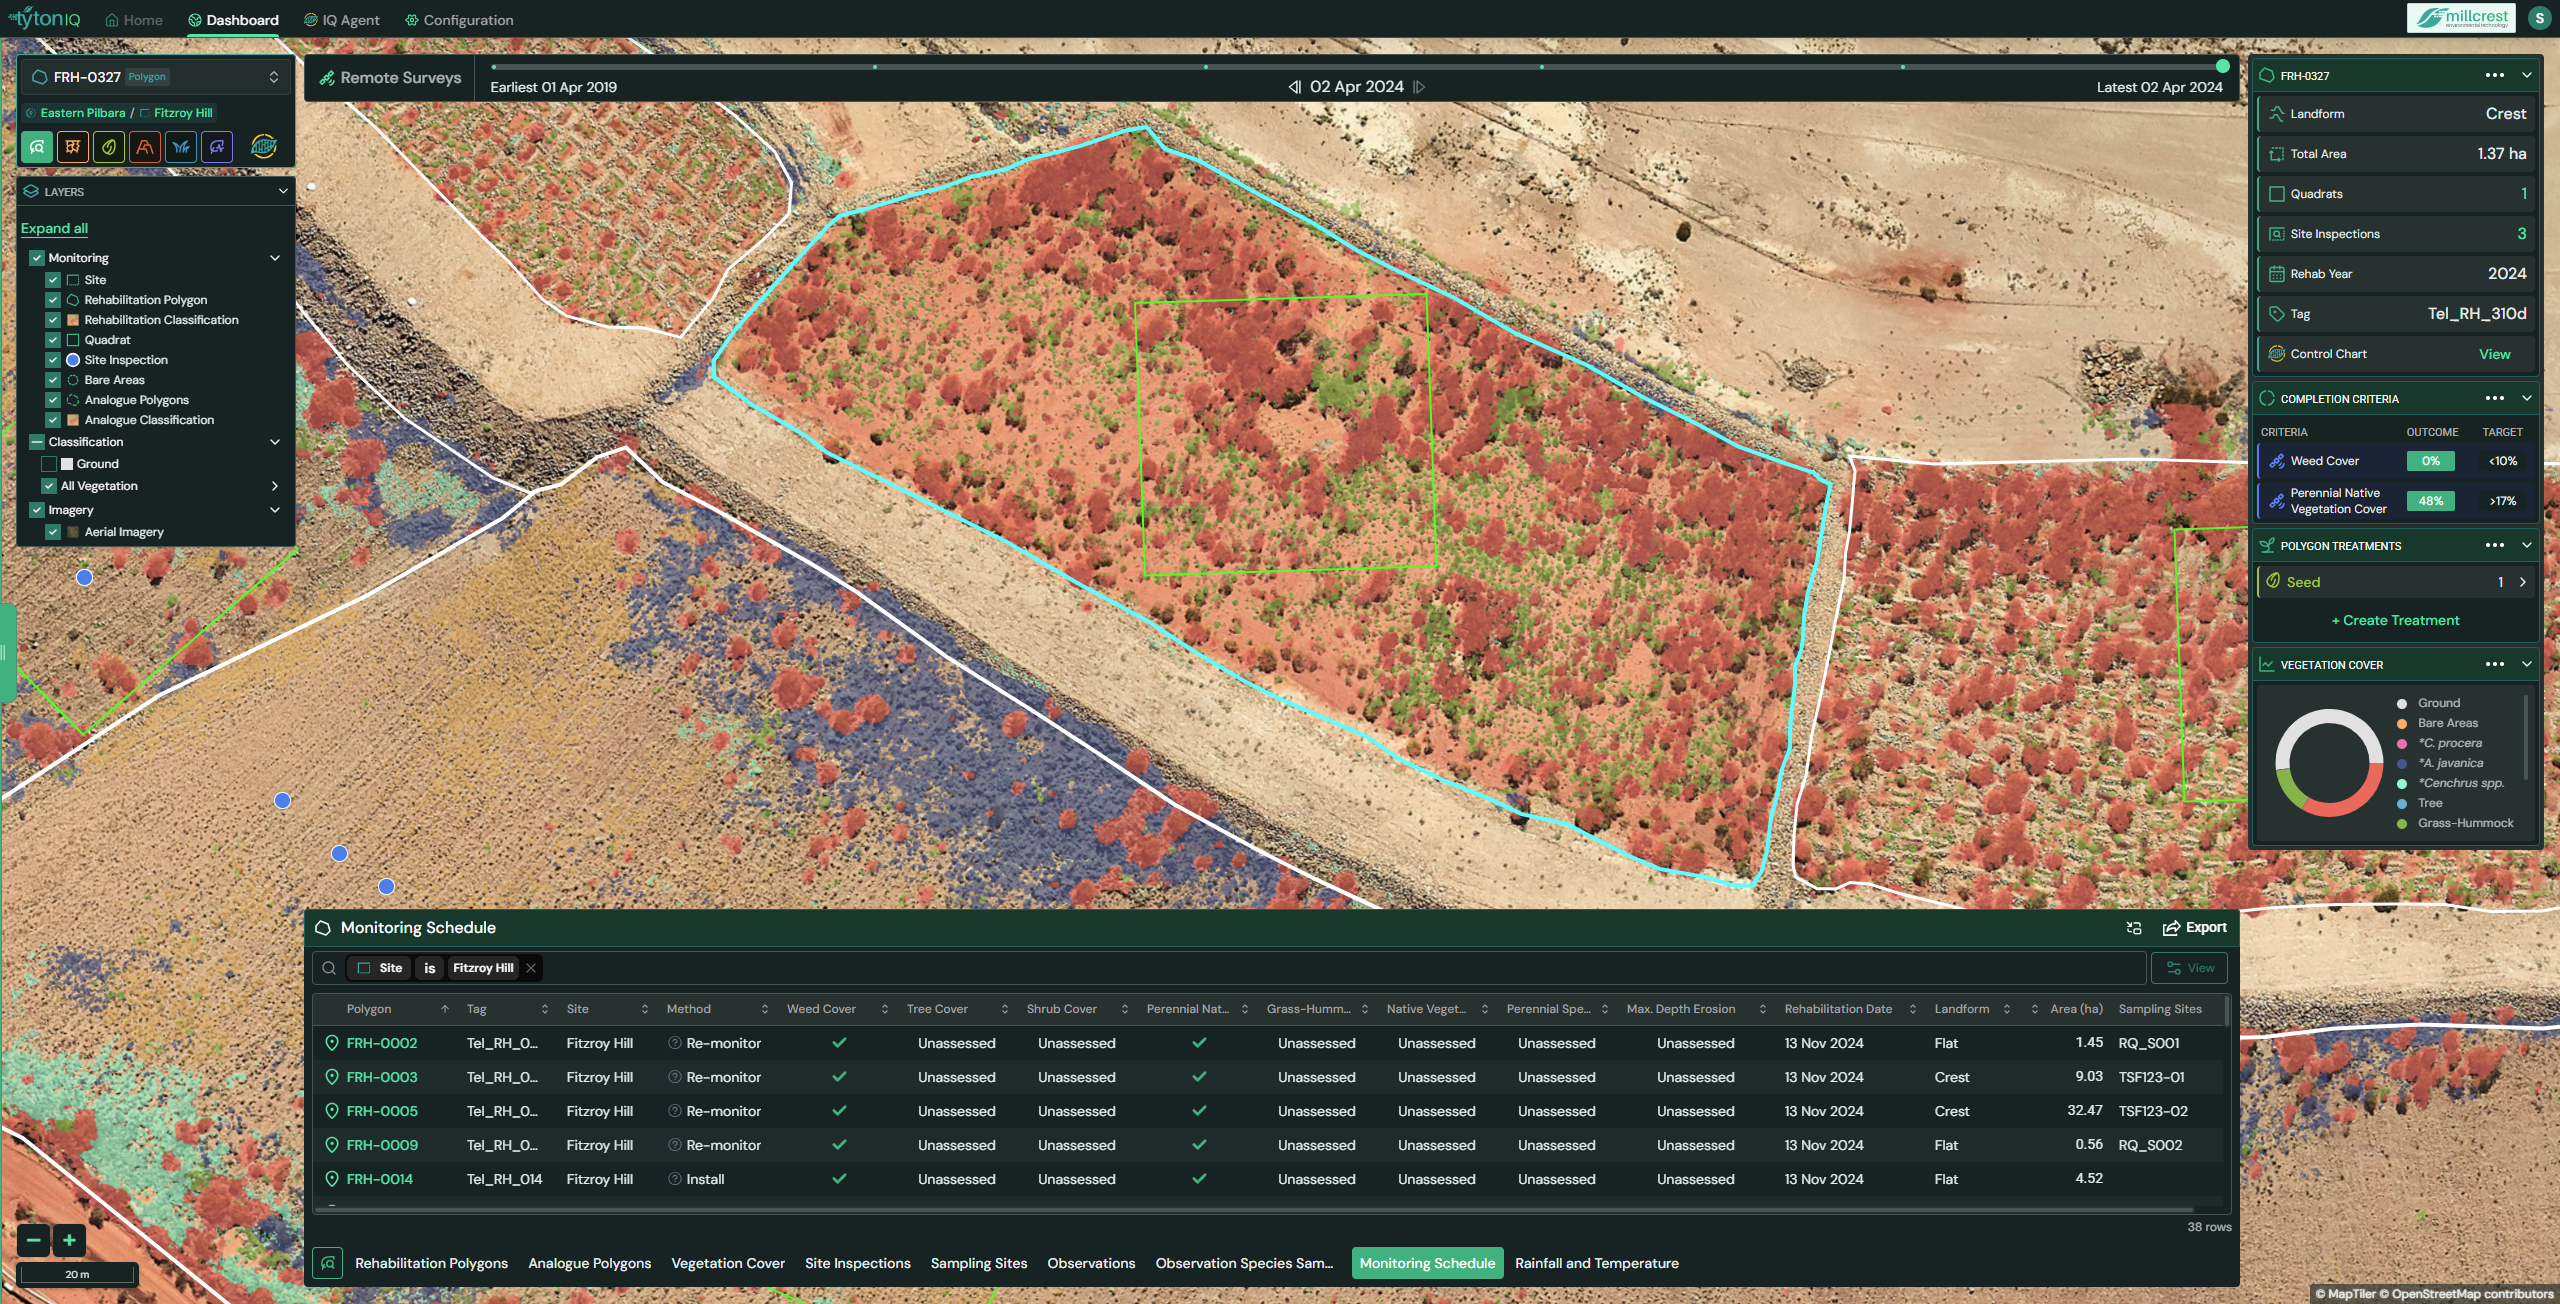
The Monitoring Schedule module in TytonIQ provides a centralised view of planned and required monitoring activities across rehabilitation polygons. It aligns polygon-level attributes, remote sensing results, and ground-based criteria to generate recommended actions. This ensures polygons are consistently assessed against ecological targets and regulatory obligations.
Key Features
1. Interactive Filtering and Navigation
Users can refine displayed polygons and their schedules in the bottom panel using filters such as:
- Polygon: Rehabilitation polygon identifier (e.g. FRH-0327).
- Tag: Assigned monitoring tag.
- Site: Project site (e.g. Fitzroy Hill).
- Method: Assigned monitoring method (Inspect, Install, Re-monitor).
- Rehabilitation Date: Year of rehabilitation establishment.
- Landform: Terrain classification (e.g. Crest, Slope, Flat).
- Area (ha): Polygon size.
- Sampling Sites: Linked sampling sites.
Completion criteria metrics (e.g. Weed Cover, Tree Cover, Perennial Native Vegetation Cover, Max. Depth Erosion) are displayed as columns, showing current outcomes compared against target thresholds.
2. Monitoring Methods
Each polygon in the schedule is assigned a monitoring method based on its progress and criteria:
-
Inspect – Polygon is failing one or more remote sensing or erosion criteria.
Action: Conduct a site inspection to validate conditions and identify management needs. -
Install – Polygon requires establishment of new on-ground monitoring sites (e.g. quadrats).
Action: Set up field sampling infrastructure to collect baseline data. -
Re-monitor – Polygon has existing sites but needs a repeat assessment to confirm ecological outcomes.
Action: Revisit the polygon and update field observations.
These methods ensure polygons are monitored consistently across their lifecycle, from installation through ongoing reassessment.
3. Polygon Data Panel (Right Sidebar)
When selecting a polygon, the right-hand panel displays detailed attributes:
- Landform: Terrain category (e.g. Crest, Flat, Slope).
- Total Area: Polygon area in hectares (e.g. 1.37 ha).
- Quadrats: Number of linked quadrats.
- Site Inspections: Count of completed inspections.
- Rehab Year: Year of rehabilitation establishment.
- Tag: Monitoring reference tag.
- Control Chart: Link to view trend-based performance.
Completion Criteria are summarised, showing outcome vs. target for key indicators such as:
- Weed Cover (e.g. 0% vs. < 10% target).
- Perennial Native Vegetation Cover (e.g. 48% vs. > 17% target).
Additional panels include:
- Polygon Treatments: Records of seeding or chemical treatments.
- Vegetation Cover Wheel: Visual breakdown of vegetation lifeforms and species groups.
4. Monitoring Schedule Table (Bottom Panel)
The bottom panel presents the monitoring schedule in a structured table. Key fields include:
| Field | Description |
|---|---|
| Polygon | Rehabilitation polygon ID. |
| Tag | Assigned monitoring tag. |
| Site | Project site name. |
| Method | Monitoring method (Inspect, Install, Re-monitor). |
| Weed Cover | Current outcome vs. target. |
| Tree Cover | Current outcome vs. target. |
| Shrub Cover | Current outcome vs. target. |
| Perennial Native Vegetation Cover | Current outcome vs. target. |
| Grass-Hummock Cover | % cover of grass-hummock species. |
| Native Vegetation Cover | Overall vegetation cover. |
| Perennial Species Richness | Richness index vs. thresholds. |
| Max. Depth Erosion | Erosion measurement vs. benchmark. |
| Rehabilitation Date | Date of polygon establishment. |
| Landform | Terrain type (Flat, Crest, Slope). |
| Area (ha) | Polygon area in hectares. |
| Sampling Sites | Linked sampling sites. |
Tooltips may display context-sensitive messages (e.g. “This polygon is failing remote sensing criteria. Suggest a site inspection.”).
5. Exporting Schedule Data
Monitoring schedules can be exported for reporting, compliance, or integration into planning workflows. Supported formats include:
- CSV – tabular schedule and metrics.
- Shapefile – spatial schedule data.
Usage Scenarios
- Compliance Monitoring: Ensure polygons meet regulator-approved ecological criteria.
- Adaptive Management: Identify polygons requiring inspections, re-monitoring, or new installations.
- Ecological Audits: Provide evidence of monitoring coverage, methods, and results.
- Operational Planning: Allocate field resources efficiently by prioritising polygons with unmet targets.