Sampling Sites
Overview
The Sampling Sites module in TytonIQ enables users to record and monitor detailed on-ground ecological data within rehabilitation polygons. Each sampling site (e.g. quadrats) stores key information such as establishment date, sampling method, species counts, and richness indicators. This module provides a reliable framework for assessing ground conditions, validating remote sensing outputs, and supporting long-term rehabilitation monitoring.
Key Features
1. Interactive Filtering and Navigation
Users can refine displayed sampling sites and associated data in the bottom panel using filters such as:
- Name: Sampling site ID.
- Site: Project site.
- Region: Broader geographical area.
- Rehabilitation Polygon: Associated polygon.
- Date Established: Original site establishment date.
- Sampling Method: Method used.
- Last Sampled: Date of most recent sampling.
- Type: Classification type.
- Slope Aspect / Landform: Terrain characteristics (e.g. Flat).
- Area (m²): Polygon area in square metres.
Filtered results appear in the Sampling Sites table at the bottom of the interface.
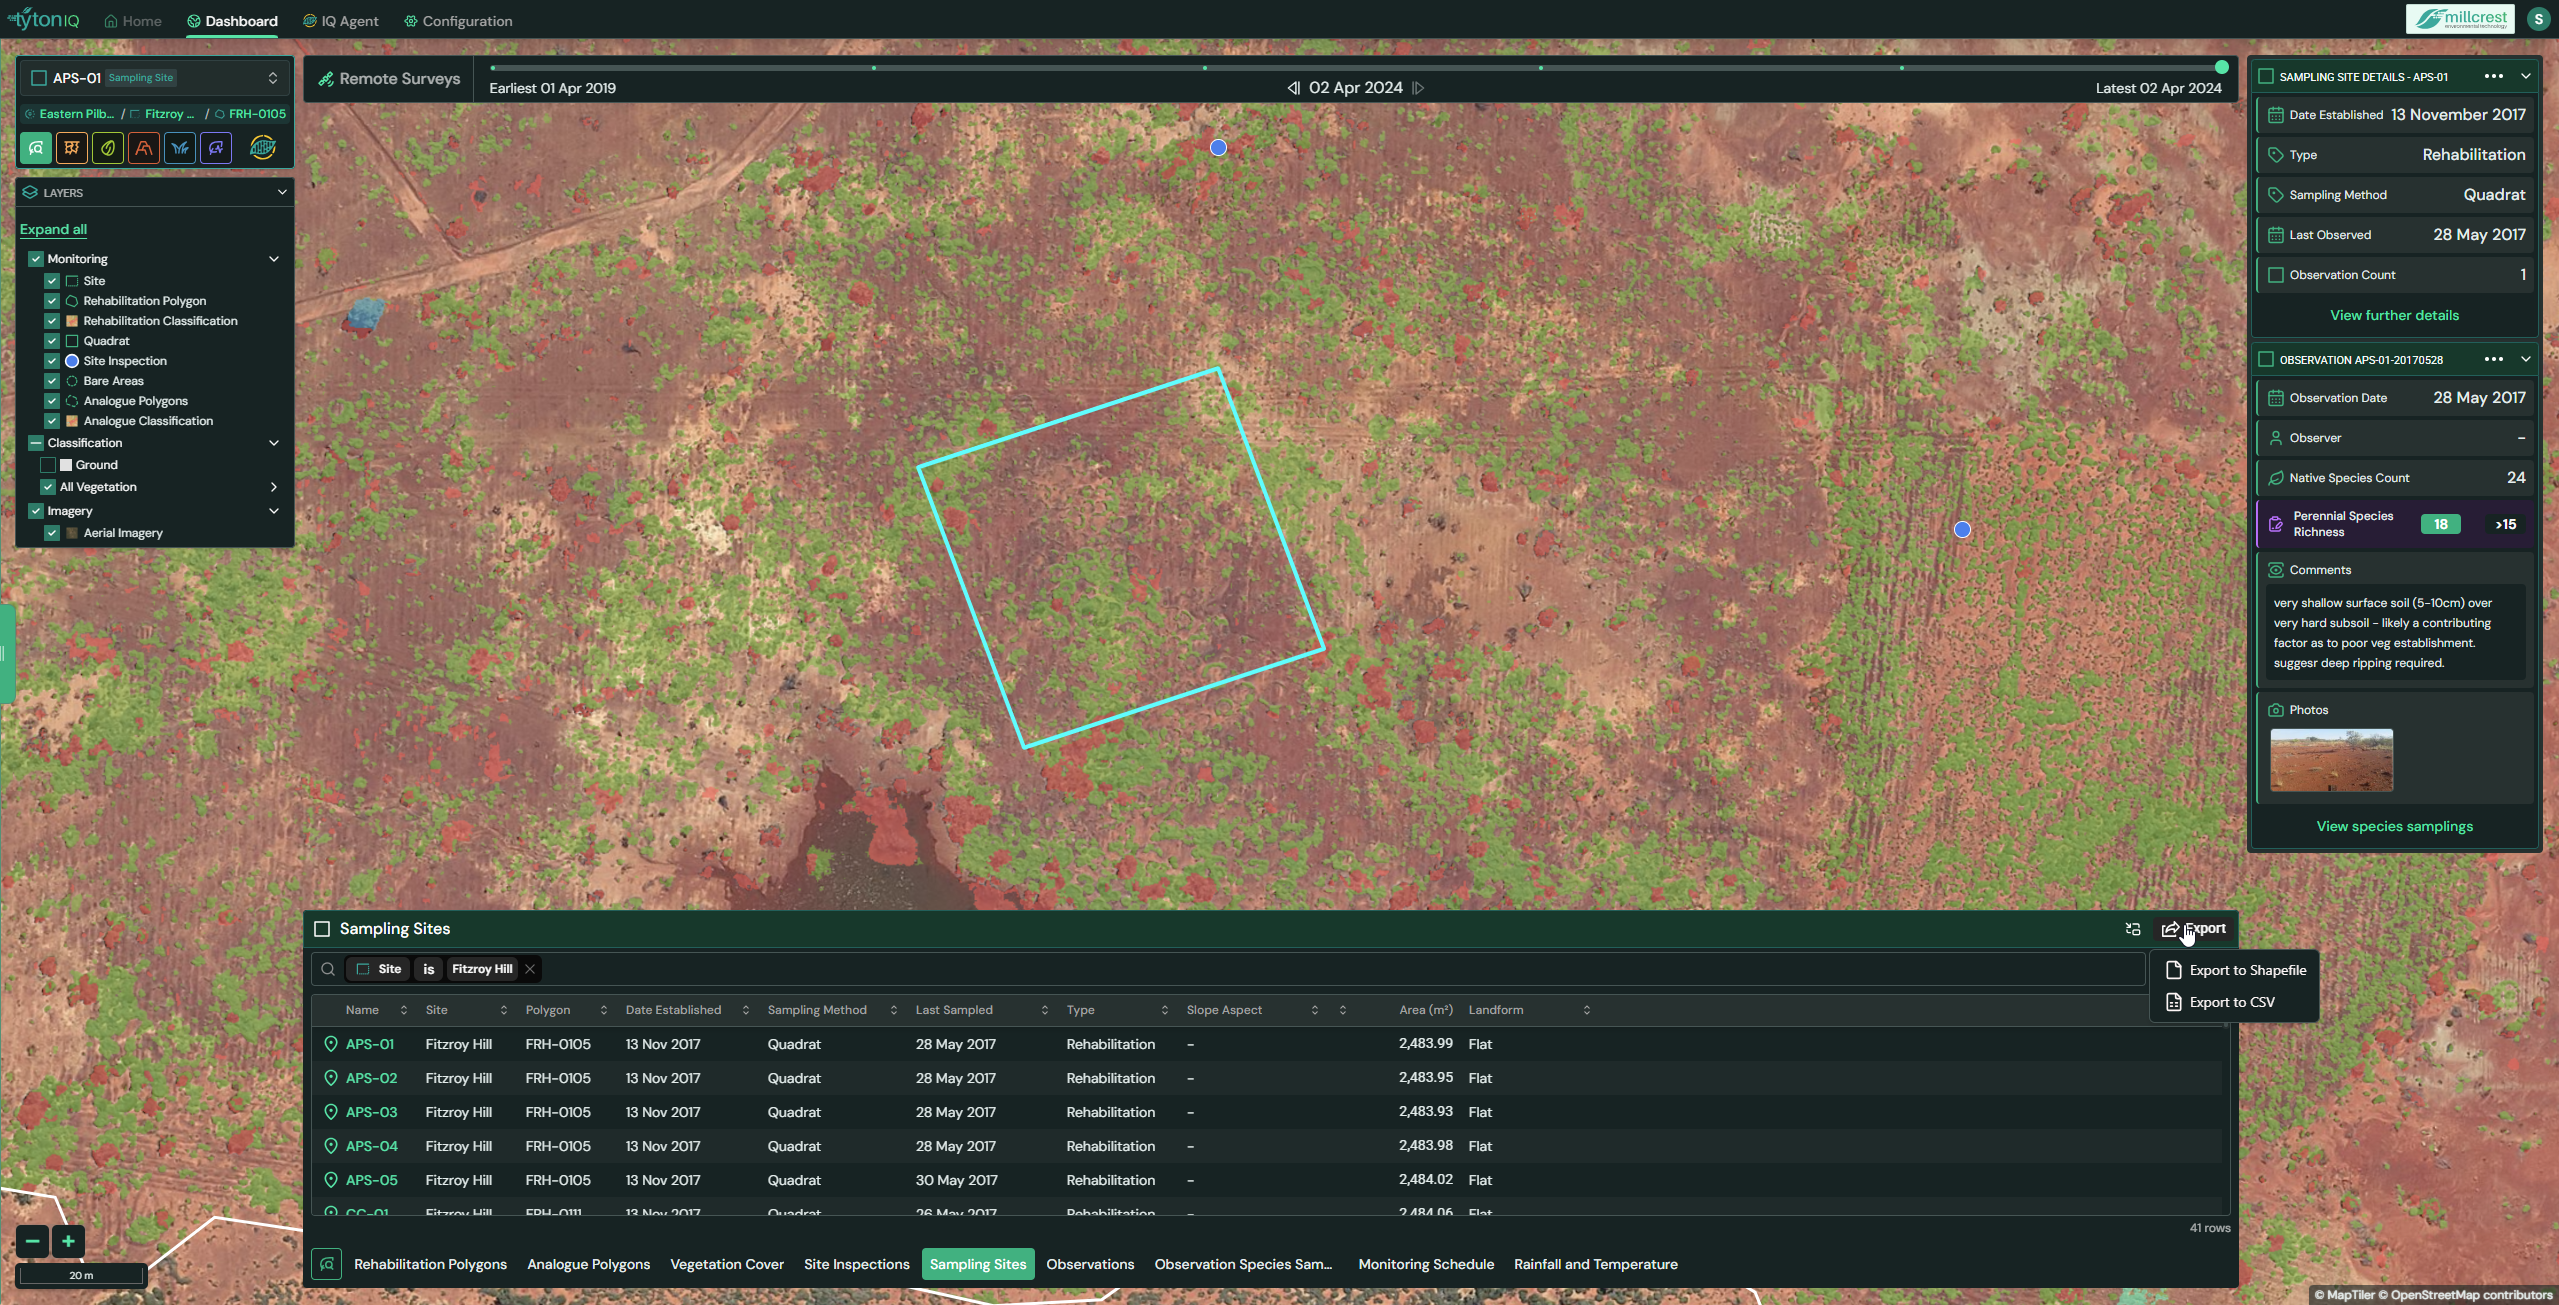
2. Sampling Site Data Panel (Right Sidebar)
Selecting a sampling site opens a detailed panel displaying key metadata and ecological metrics:
- Date Established: When the sampling site was first created.
- Type: Classification type.
- Sampling Method: Method used to record ecological data.
- Last Observed: Date of most recent survey.
- Observation Count: Number of associated observations.
Below this, Observation details for the most recent survey are listed, including:
- Observation Date: Date of recorded observation.
- Observer: Inspector name (if recorded).
- Native Species Count: Number of native species identified.
- Perennial Species Richness: Diversity index with threshold indicator.
- Comments: Field notes describing site conditions.
- Photos: Linked imagery from the observation for context.
A shortcut button (View species samplings) links to species-level records collected at the site.
3. Sampling Site Table (Bottom Panel)
The lower panel provides a searchable, sortable table of sampling sites. Core data fields include:
| Field | Description |
|---|---|
| Name | Sampling site ID. |
| Site | Project site |
| Polygon | Associated rehabilitation polygon |
| Date Established | Establishment date of the site |
| Sampling Method | Method used. |
| Last Sampled | Date of most recent sampling. |
| Type | Site classification type. |
| Slope Aspect | Terrain slope orientation. |
| Landform | Terrain category (e.g. Flat). |
| Area (m²) | Area of the rehabilitation polygon. |
The table can be toggled using the View button or exported for offline use.
4. Exporting Sampling Site Data
Sampling site records can be exported for reporting, analysis, or integration with external systems. Available formats include:
- CSV – tabular data for spreadsheets.
- Shapefile – GIS-compatible format.
Usage Scenarios
- Baseline Field Data: Establish long-term monitoring plots with consistent methods (e.g. quadrats).
- Ground-Truthing: Validate and complement satellite-based vegetation metrics with field-collected data.
- Rehabilitation Performance: Monitor trends in species richness and native plant establishment over time.
- Compliance & Reporting: Provide robust evidence of field observations for stakeholders and regulators.