Rainfall and Temperature
Overview
The Rainfall and Temperature module in TytonIQ integrates climate data from nearby weather stations into the monitoring dashboard. This allows users to evaluate how seasonal conditions such as rainfall events and temperature extremes affect rehabilitation outcomes. Climate trends provide essential context for interpreting vegetation performance, species establishment, and site condition assessments.
Key Features
1. Interactive Filtering and Navigation
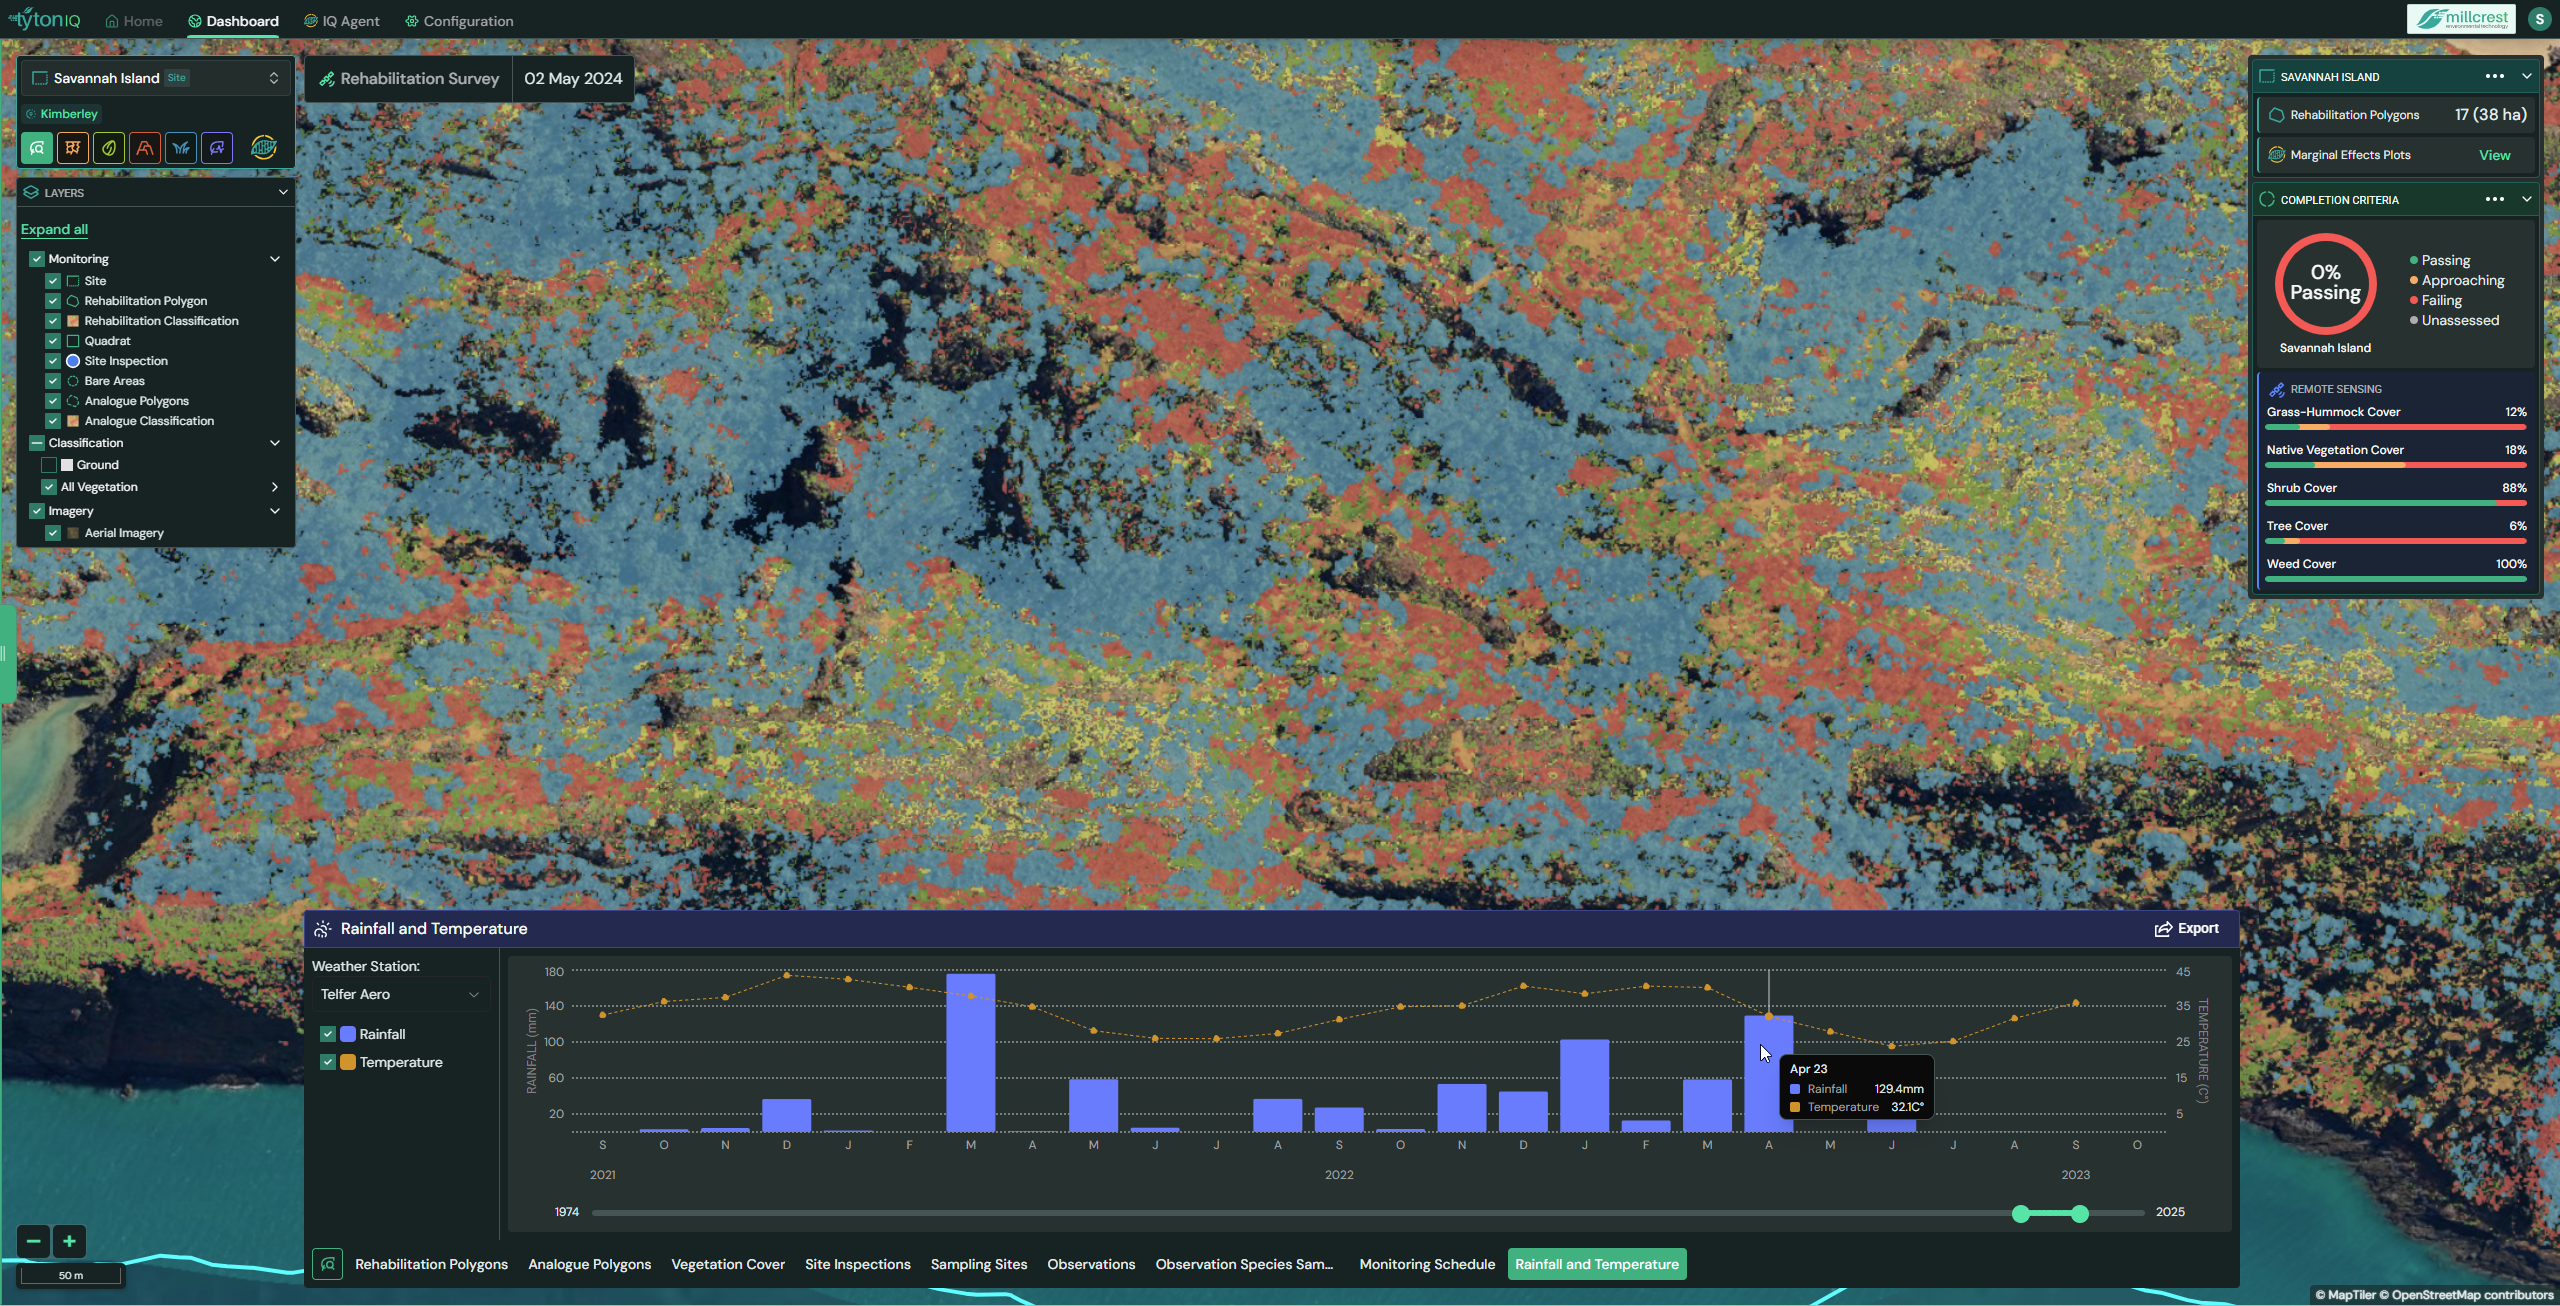
Users can refine rainfall and temperature data displayed in the bottom panel by:
- Weather Station: Select the climate station source.
- Date Range: Use the timeline slider to adjust the displayed period.
- Overlay Options: Toggle rainfall and temperature datasets on or off for comparative analysis.
2. Rainfall and Temperature Panel (Bottom Chart)
The bottom panel displays a combined rainfall and temperature chart:
- Rainfall (bars): Monthly rainfall values (mm). Example: 58.4 mm in March 2023.
- Temperature (line): Average monthly temperature (°C). Example: 40.1°C in March 2023.
- Dual-axis chart: Rainfall is shown against the left axis (mm), temperature against the right axis (°C).
- Interactive Tooltips: Hovering over a point shows exact rainfall and temperature for that month.
This provides a clear picture of climate variability across the monitoring period.
3. Site-Level Integration (Right Sidebar)
The Rainfall and Temperature module is shown alongside ecological completion criteria in the sidebar. This contextualises performance by combining:
- Rehabilitation Polygon Count (e.g. 17 polygons, 38 ha).
- Completion Criteria: Passing percentage and colour-coded status.
- Remote Sensing Metrics: Vegetation cover results (e.g. Shrub Cover, Tree Cover, Weed Cover).
By aligning climate inputs with polygon outcomes, users can assess whether rehabilitation trends are linked to seasonal rainfall or heat stress.
4. Exporting Climate Data
Rainfall and temperature data can be exported for further analysis or reporting:
PNG Image – monthly rainfall and temperature records.
Usage Scenarios
- Climate Context: Understand how rainfall and temperature influence rehabilitation outcomes.
- Trend Analysis: Track droughts, wet seasons, and heat events over multiple years.
- Adaptive Management: Plan seeding and planting activities around favourable climatic windows.
- Compliance & Reporting: Provide climate-linked evidence for regulatory submissions or research studies.